How to deploy monitoring on your VPS with Coolify and Netdata
Deploy server-wide monitoring with Netdata and Docker compose for any VPS. Use in Coolify with a GitHub repository.

I've been searching for information or articles about Coolify but there is not enough! I'll start writing some articles about self-hosting it and what issues I've faced along the way. One basic thing it misses in my opinion is deploying a container that tracks the whole server resources. This is why I'll show you how to deploy your own with Netdata and docker-compose.
I'm NOT affiliated with this project, I just like it!
We're going to need:
- Private GitHub repository
- Deployed Coolify
- Authorized GitHub app for connecting private repositories to Coolify (if you don't have one, check their documentation)
Creating our docker-compose
Open up your repository and create at top-level a file named docker-compose.yaml. It's needed so it can set up our Netdata container and allow us the possibility to extend it. Netdata is set to use Docker container names.
version: '3.7'

services:
  netdata:
    image: netdata/netdata:v1.47.4
    container_name: netdata
    ports:
      - "19999:19999"  # Expose Netdata UI on port 19999
    restart: unless-stopped
    cap_add:
      - SYS_PTRACE  # Required for monitoring
    security_opt:
      - apparmor=unconfined  # Allow more permissions for Netdata monitoring
    volumes:
      - ./netdata/config:/etc/netdata  # Custom configuration files from your repo
      - netdata_lib:/var/lib/netdata  # Persistent storage for historical data
      - netdata_cache:/var/cache/netdata  # Cache directory for faster performance
      - /proc:/host/proc:ro  # System metrics
      - /sys:/host/sys:ro
      - /etc/os-release:/host/etc/os-release:ro
      - /var/run/docker.sock:/var/run/docker.sock  # Docker socket for container metrics
    environment:
      - DOCKER_HOST=unix:///var/run/docker.sock  # Set Docker socket for container names
    healthcheck:
      test: ["CMD", "curl", "-f", "http://localhost:19999"]
      interval: 30s
      timeout: 10s
      retries: 5

volumes:
  netdata_lib:
  netdata_cache:
Against each configuration is a comment for a better understanding of what it does. We've also added a health check to know if something is wrong with our netdata integration. To create a custom configuration for our application, create a folder with a file named netdata/netdata.conf with the following content. You can extend this configuration with custom options that netdata accepts.
[global]
  run_as_user = netdata
  web_mode = static-threaded  # Optimizes for multi-core systems and high traffic
  memory mode = save  # Saves memory usage by keeping data on disk, minimizing RAM usage

[health]
  enabled = yes  # Enable health monitoring and alerts

[logging]
  type = none  # Disable excessive logging for production environments
Your structure should look as shown.
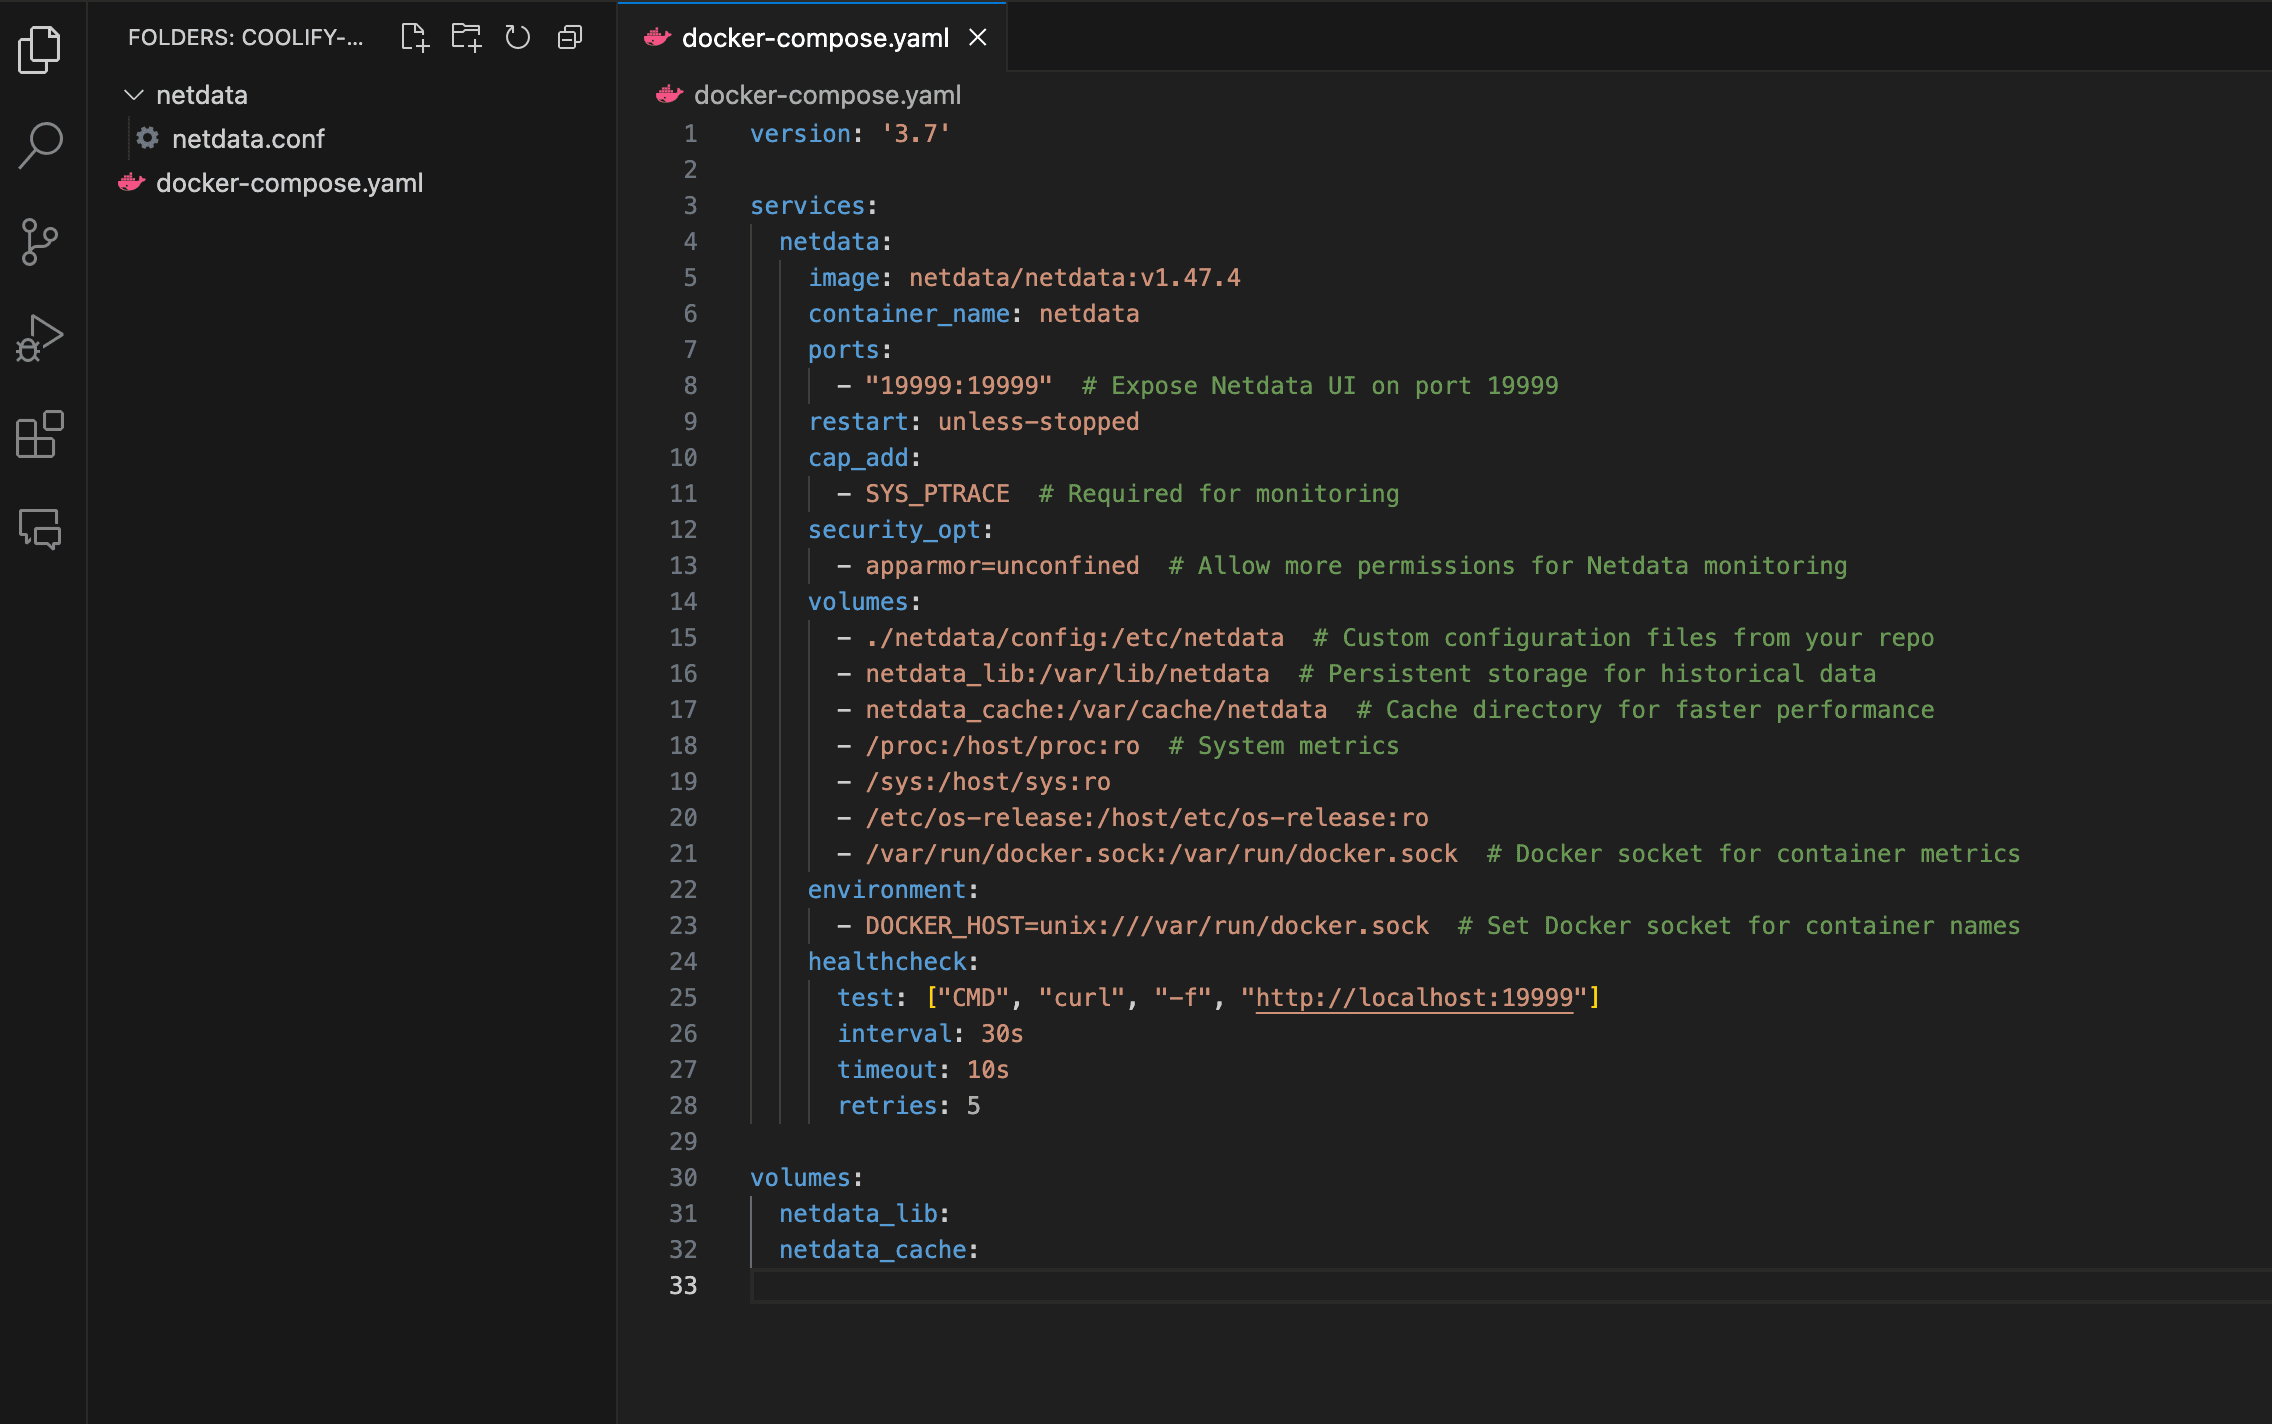
Coolify GitHub integration
Moving to our Coolify dashboard.
- Go to Projects -> Add. I've decided to name it monitoring as I'll further extend it. (You can use an existing project, this is not a required step)
- Move to Resources -> New -> Choose Private Github Repository
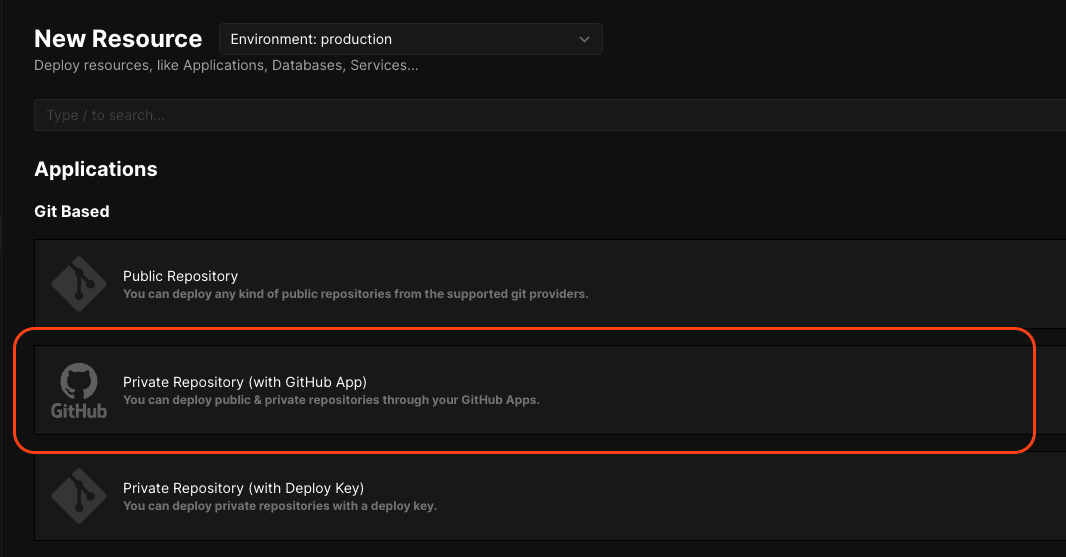
- Load the repository you've just created the docker-compose into and we'll configure it later
If you like my articles a subscribe to my X account and newsletter is highly appreciated! The newsletter is in the footer along with my other social media accounts!
Run our Netdata integration
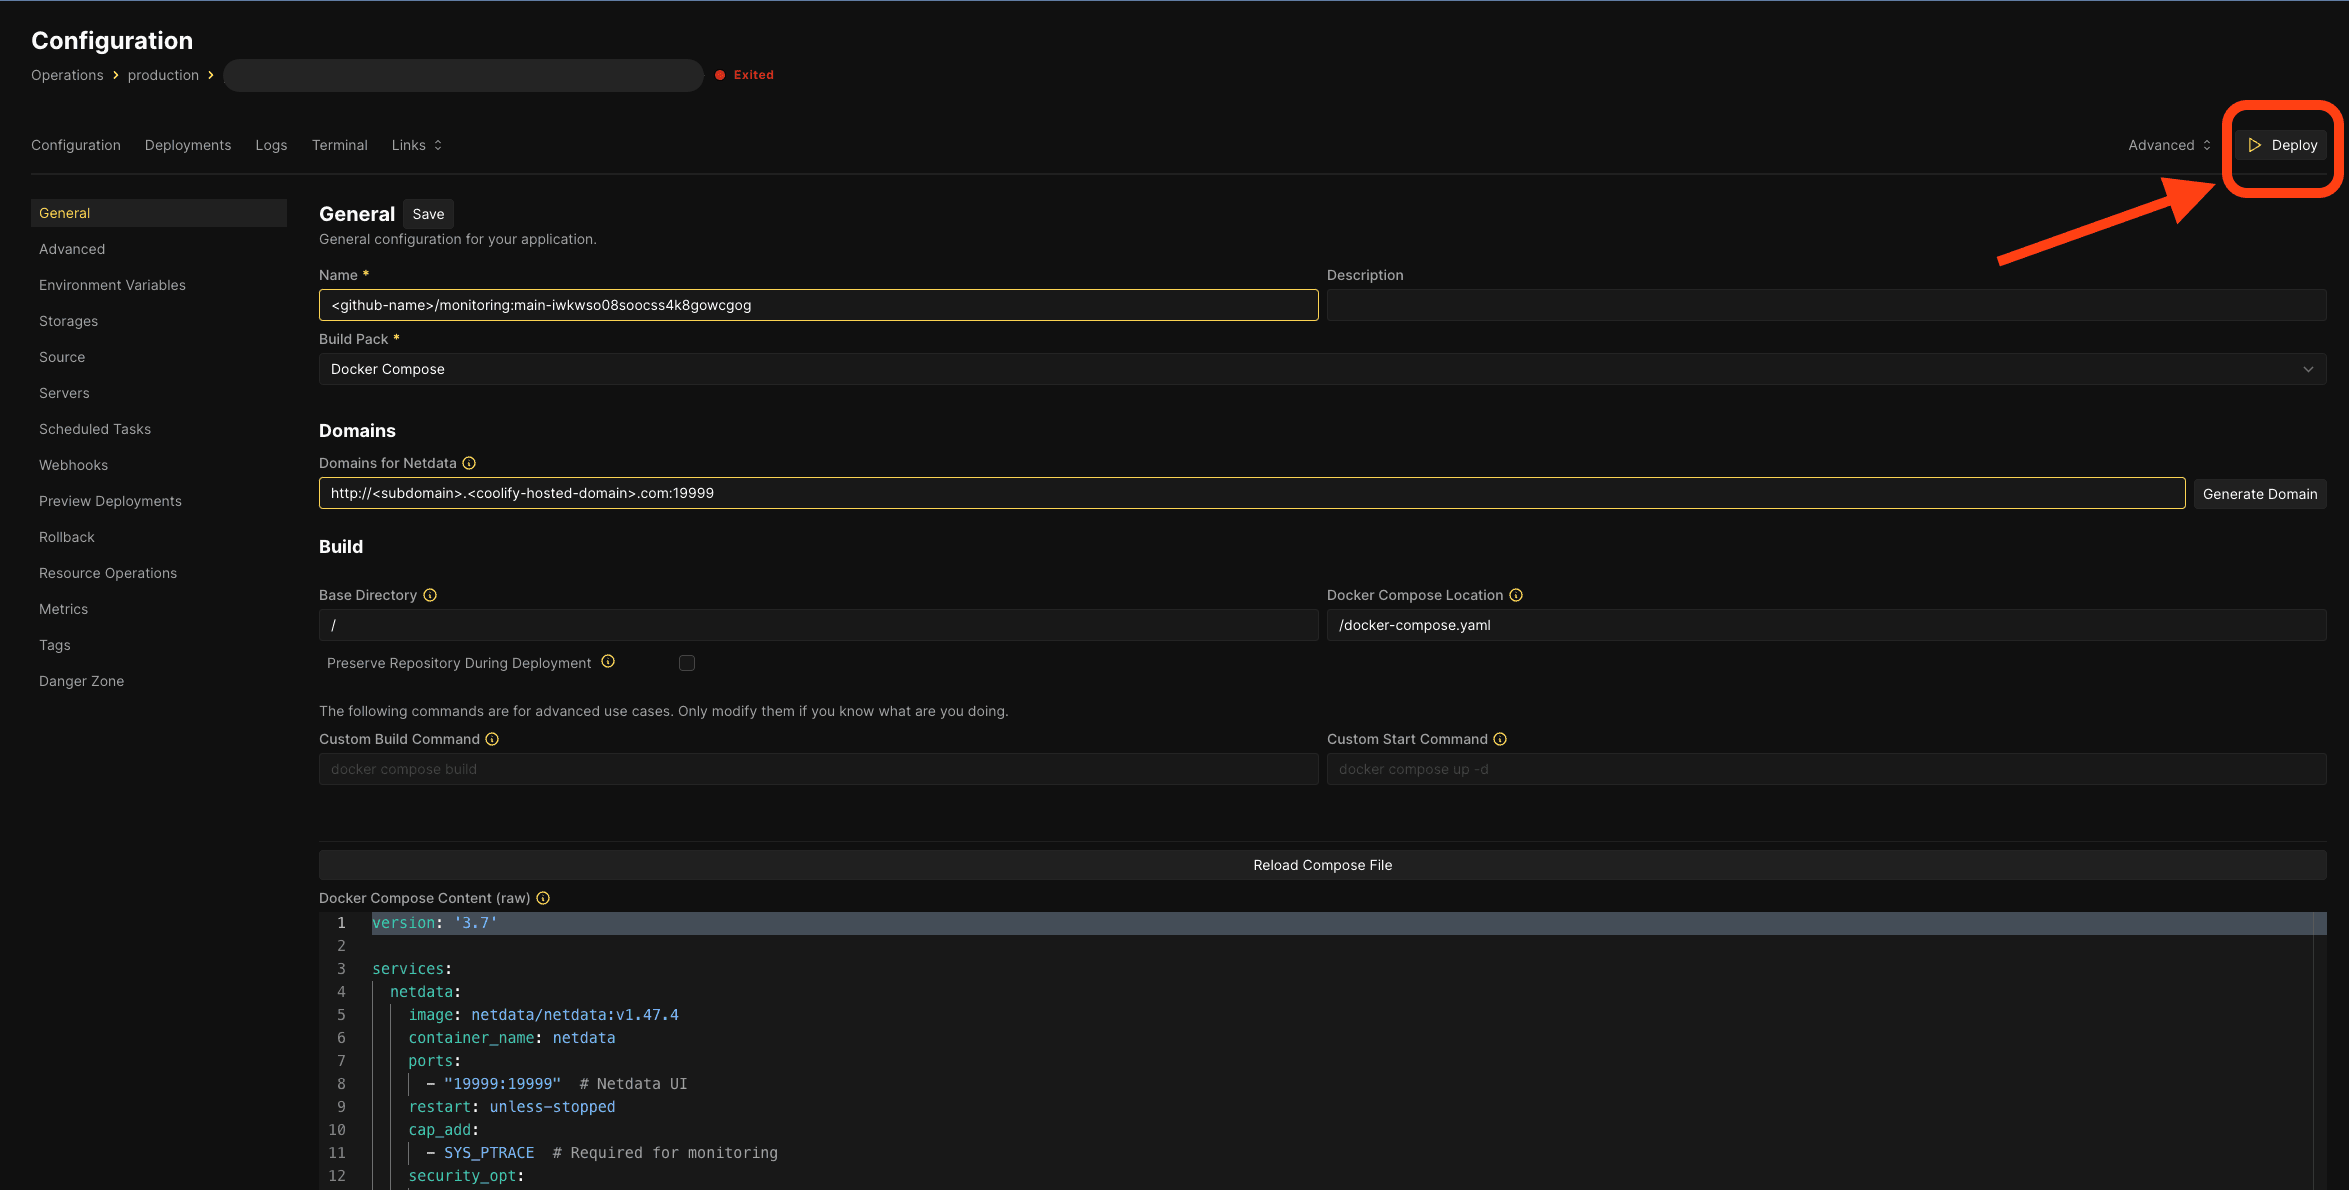
We'll have automatically set for us a configuration name with:
- <github-username>:repo + random hash
We need to change the Build pack to Docker compose and point to our file if not automatically pointed already. The domains section is if our Coolify instance is exposed with CF Zero Trust. (Mine is, and I'll write an article on how to set it up!)
Just hit the Deploy button and wait for the status to change from Exited to Running.
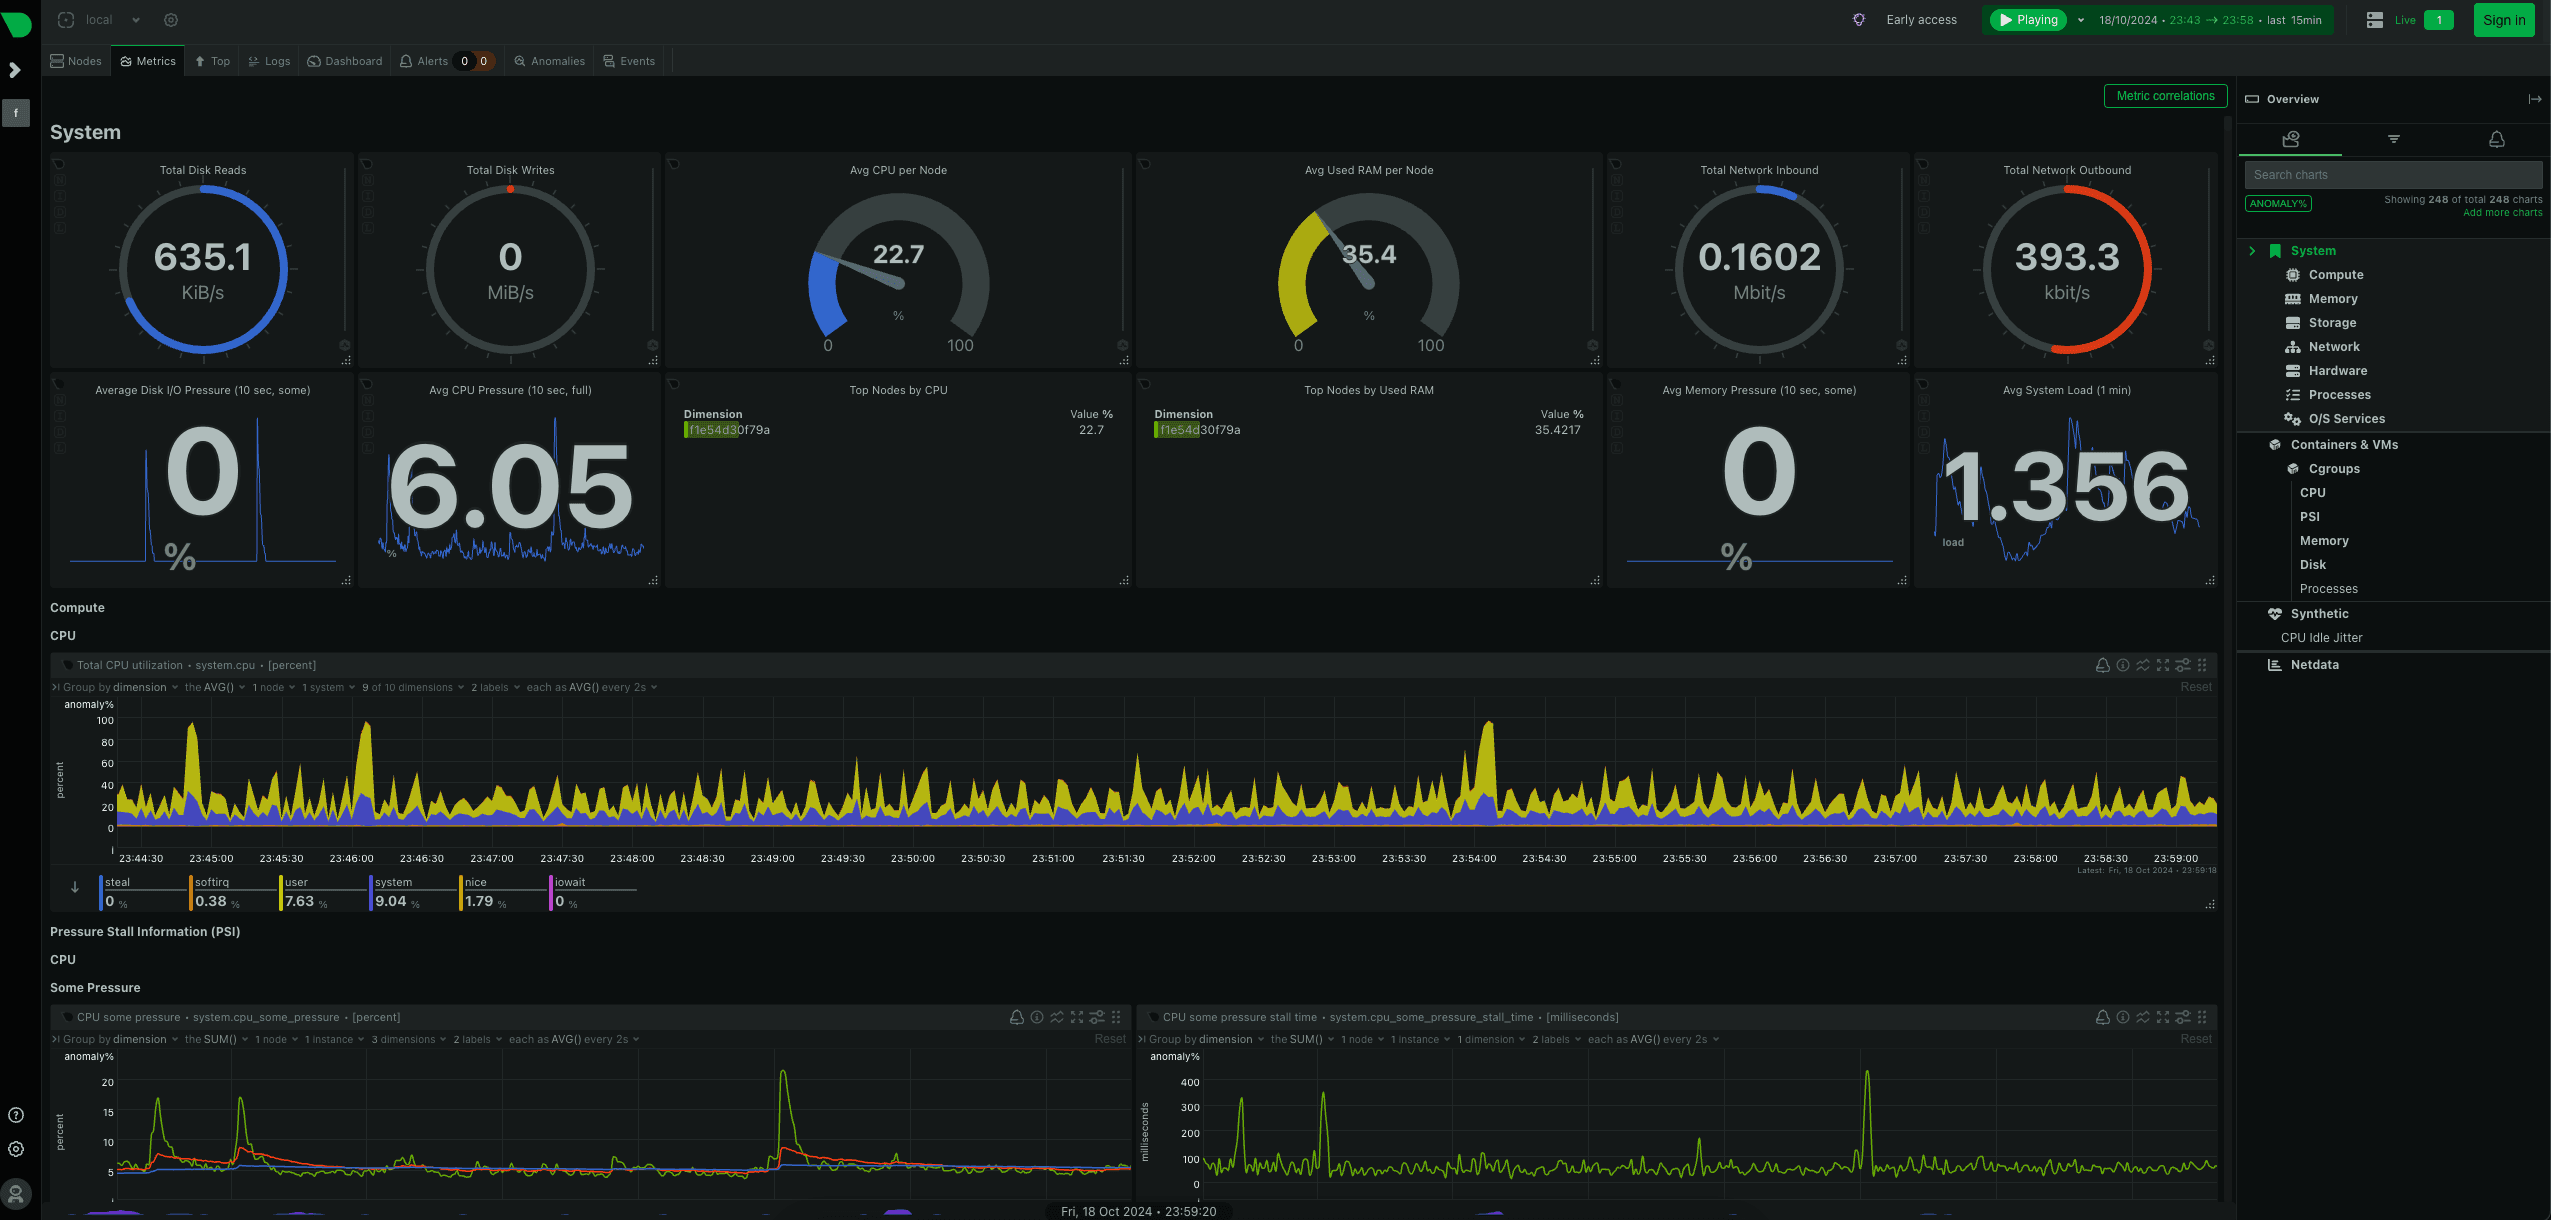
Netdata Dashboard
As there is no outside domain linked you need to SSH into your machine and port-forward the dashboard to see it. Use the command below and change with your own VPS username and IP.
ssh -L 19999:localhost:19999 <vps-username>@<vps-ip>When triggered it would most likely ask for your password, just type it and hit enter. Voila!
You should be able to see your dashboard on http://localhost:19999 and see something similar to this.
Final words
This is our basic integration. It could be further expanded by adding it to Grafana and exposing it through CF Applications with GitHub oAuth so it is accessible only to you or your team. One thing to do next is add Discord alerts for high CPU usage or similar alerts. I've already covered this in the article How to Add Discord Alarms.
With self-hosting it's possible to extend it as much as your skills allow you to. I'm diving into this "world" more and more!
If you have any questions, hit me up on Twitter/X or LinkedIn. At both places a follow is highly appreciated!
You can subscribe to my newsletter below to get notified about any new articles coming out. I'll not spam you!
Related articles

Deploy Prometheus and Grafana in Coolify (Code Example)
Step by step tutorial to deploy prometheus and grafana in coolify with human readable names.
How to add REDIS in Coolify with NestJS?
Adding REDIS is a performance boost, and you can easily do so in Coolify.

How to add Discord alarms to self-hosted Netdata (Coolify)
Having monitoring without alerts is like having a laptop without internet. It's good to have, but mainly useless.

How to Build Robust Integrations for your Application? The production way!
Third-party integrations sound easy, but doing them in a way to not degrade the performance of your app is hard.

Is Coolify Good for Production Deployments?
Self-hosting with Coolify can be a pleasent adventure, but you need to know the pros and cons.

Create Production Dockerfile for NextJS - Deploy Everywhere
Dockerfiles aren't hard to do. You do it once per framerwork like NextJS and use everywhere!
My Newsletter
Subscribe to my newsletter and get the latest articles and updates in your inbox!