Deploy Prometheus and Grafana in Coolify (Code Example)
Step by step tutorial to deploy prometheus and grafana in coolify with human readable names.

I'll share how I deployed Prometheus and Grafana in Coolify. The biggest "blocker" for me was that it had poor labels, and it was unclear what each name meant.
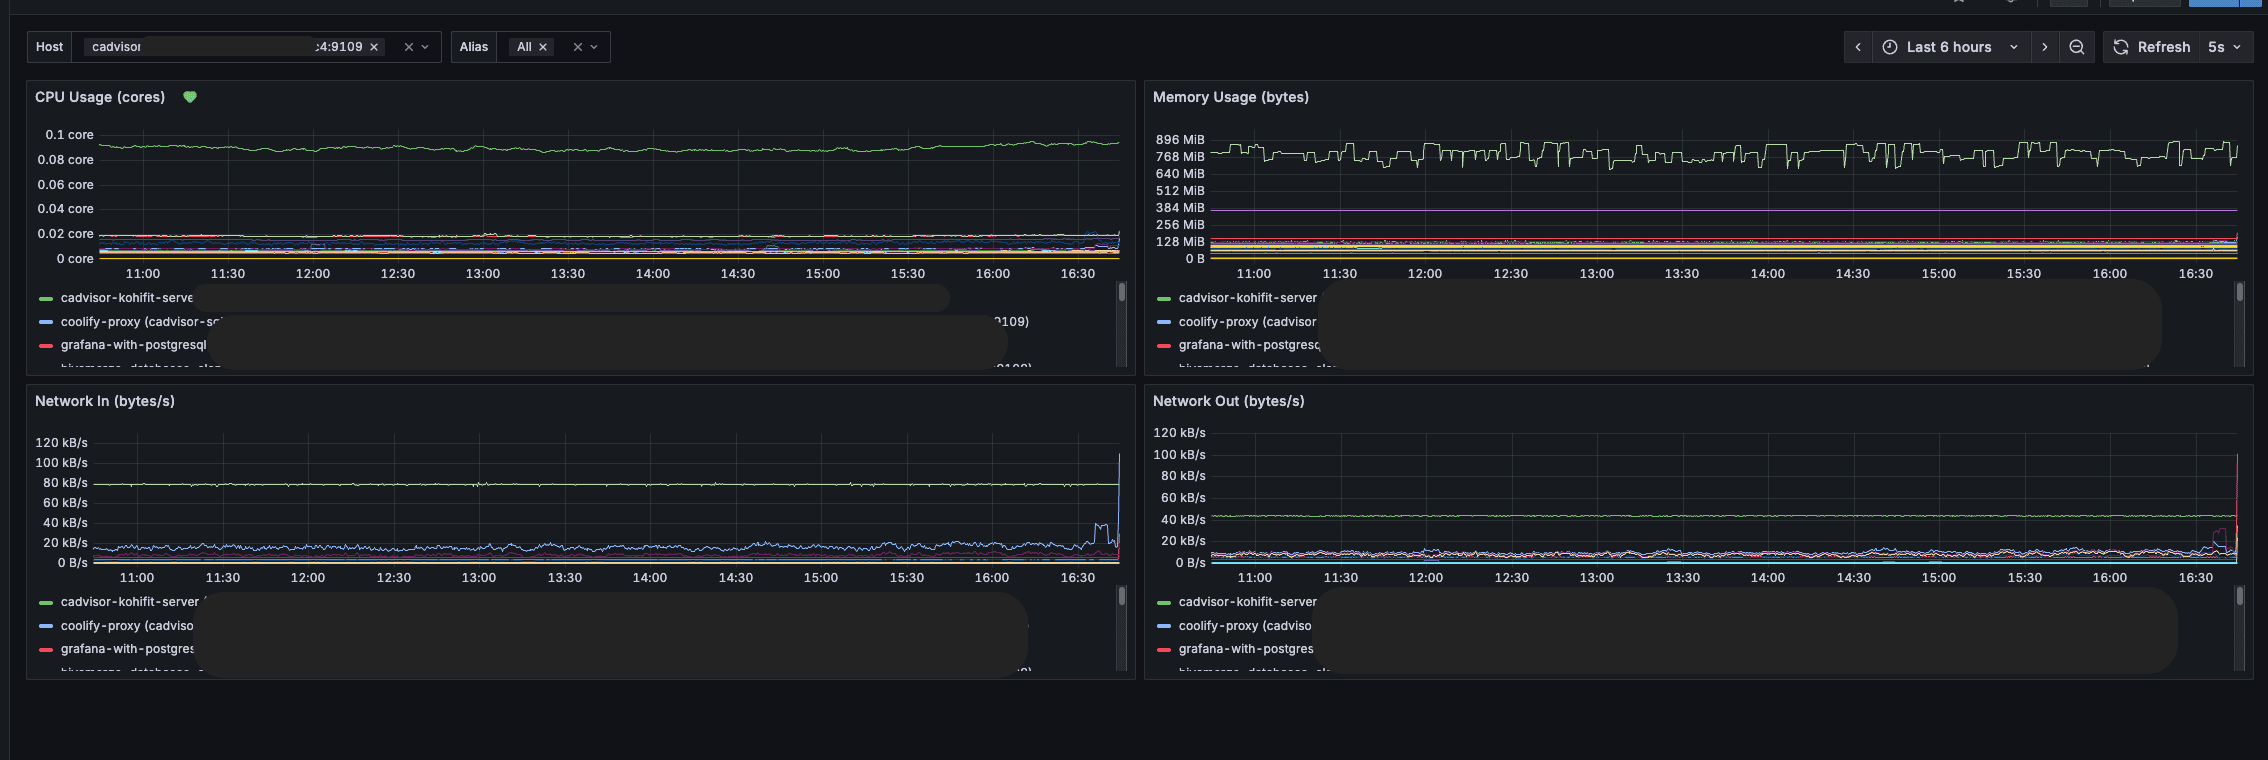
The tutorial will be step-by-step to show how I've done it, with code examples to directly copy/paste into your own setup. I DON'T say this is the best way, but I didn't find any good information online, so I did it myself, and it works perfectly for my use cases. Here is a part of the end result before we start:
What does this tutorial assume you have and know?
There are a few things you need to know and have for this tutorial to make sense for you.
- Deployed Coolify instance (self-hosted or cloud)
- GitHub app connected (we're going to create a new Prometheus repo)
First is because we'd be using a template for Grafana with Postgres, and the second is because we'd deploy a "repository" with our Prometheus implementation.
We'd also add one more service as a Docker compose in Coolify to get all the metrics we'd need as cAdvisor.
Deploying Grafana with Postgres
This is quite an easy step with Coolify. You just open in Coolify:
- Projects
- Operations (or any project you created of your choosing, the name doesn't matter, if you don't have one, just create)
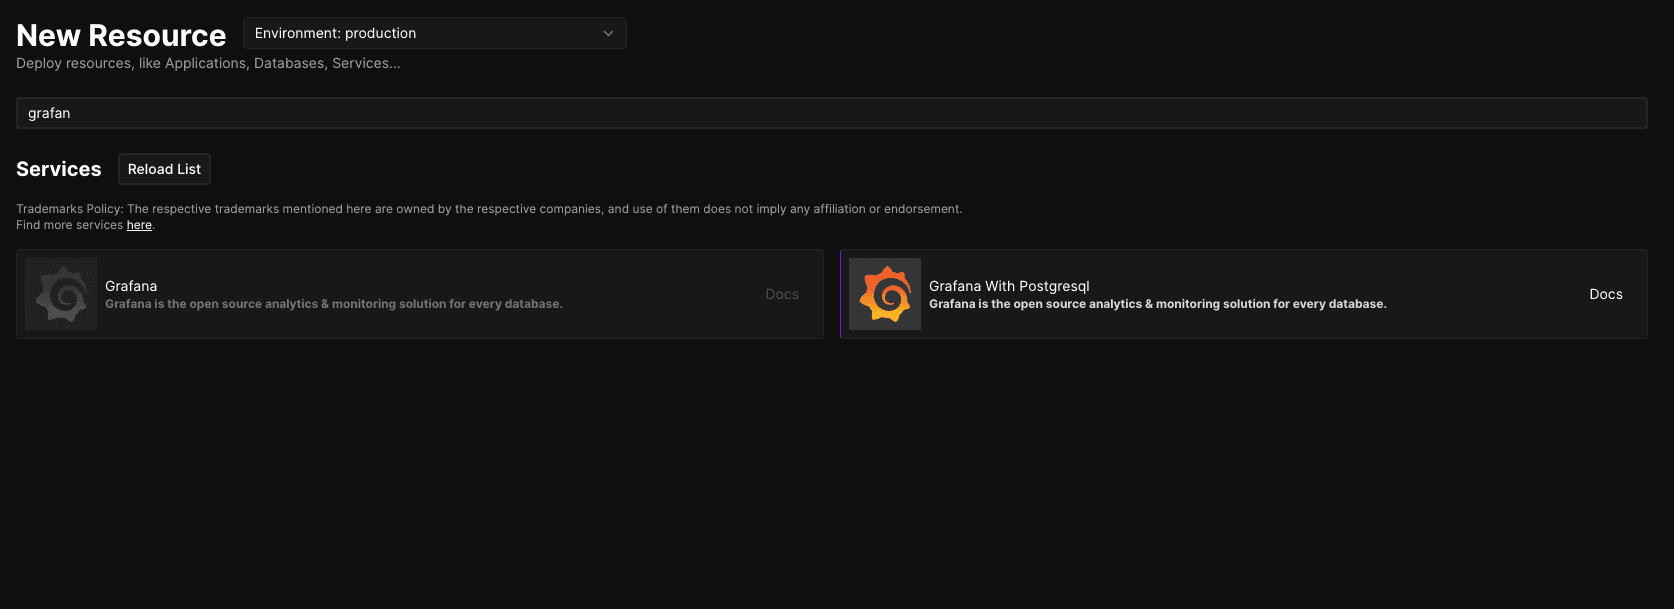
- Click Add Resource, and search for Grafana as on the photo, and choose Grafana with Postgresql and choose a server
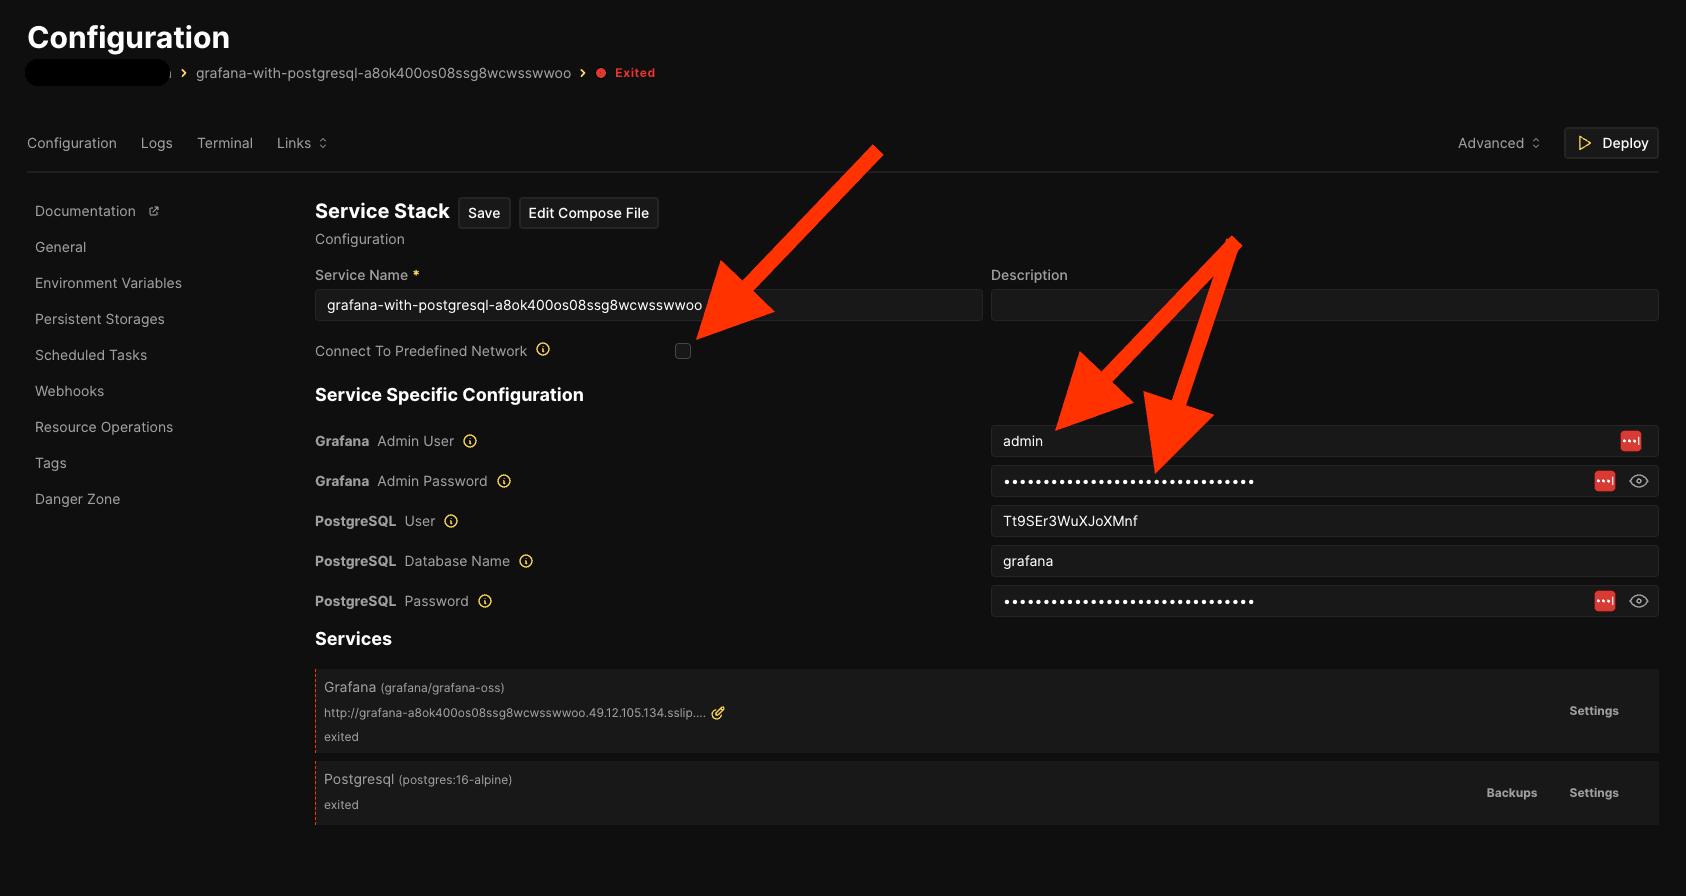
Adding the resource, you'll see a few options. We care about:
- Connect To Predefined Network (to be ticked)
- Grafana - username/password. We'll be logging in with those
- Settings - Grafana With Postgresql (grafana/grafana-oss) - here we're going to put the domain where our instance will be "available"
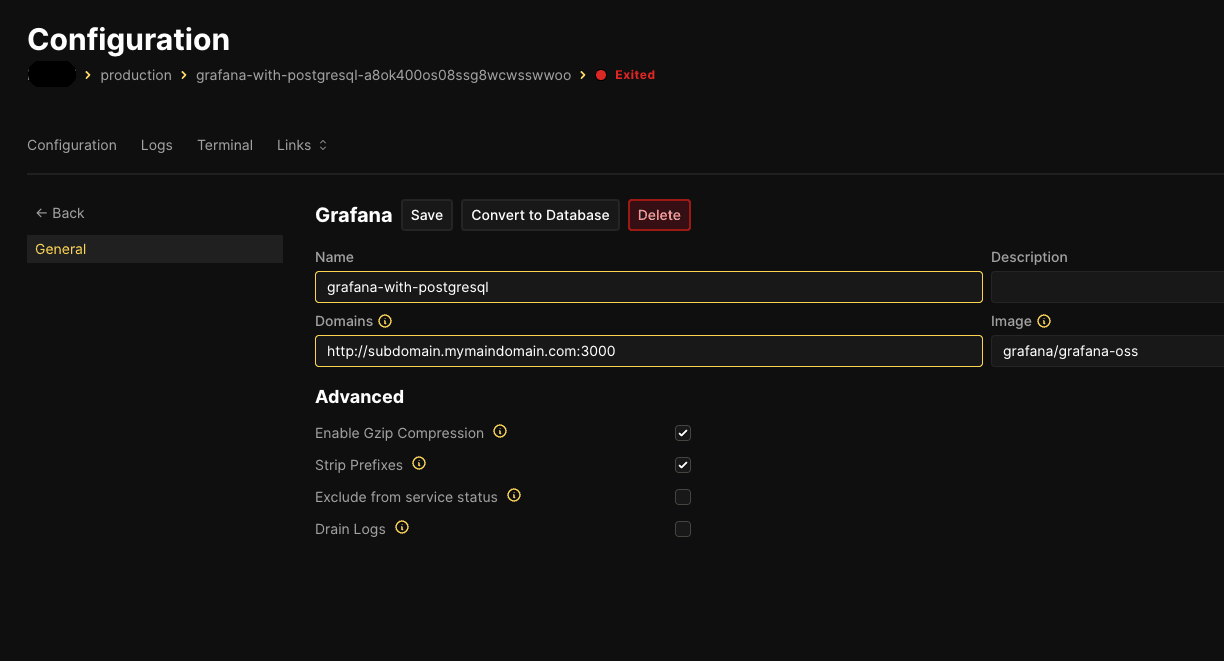
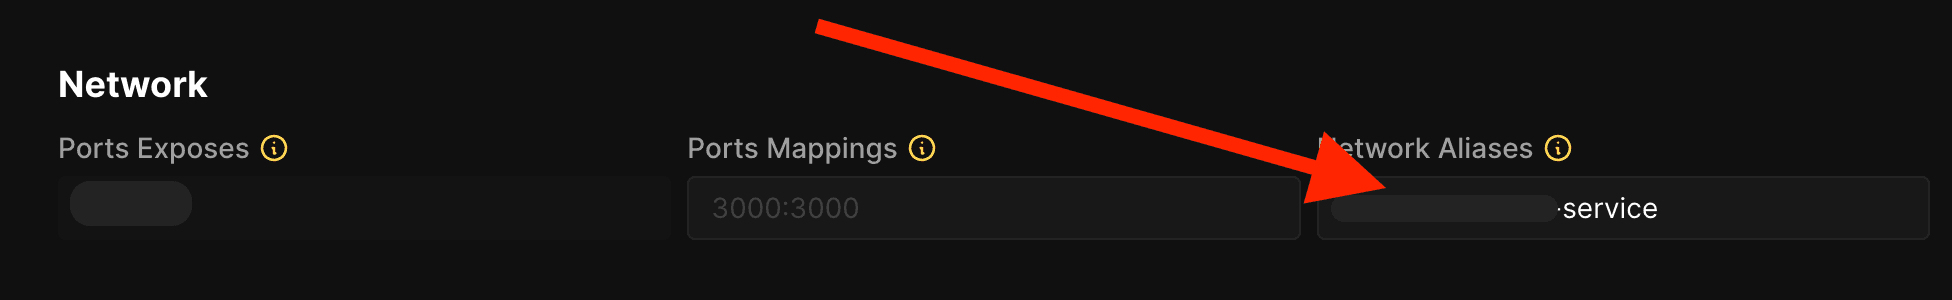
 Go to Grafana settings at the bottom right. You'll see a screen as the photo below. You need to:
- Add your domain/subdomain for the hosted instance. It should be with http if you're using Cloudlfare Tunnels. Most importantly, it should finish up with :3000
- Choose some readable name for your service, and save.
You can now hit "deploy", and you're instance should be up & running.
Hey, writing articles takes a lot of time! If you like them, I would greatly appreciate it if you could give me a follow on X/Twitter (just started there) as I'm building my audience... Subscribing to my newsletter is highly appreciated too; it's in the footer, along with all my social media accounts!
Setting up the Prometheus repository
I won't get into details on how to set up a new GitHub repository, as I assume you already can if you're self-hosting anyway.
Create a new repository, and I'll share the structure you need to have for our project to work below.
- prometheus.yml
- Dockerfile
- .nvmrc (optional, I just like having in each repo)
- rules/* (here we add each rule that we're going to use)
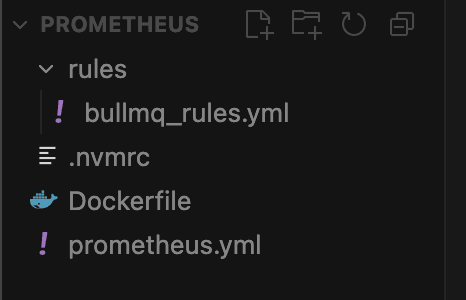
In my photo above, I have bullmq_rules.yml, but you probably won't even need rules at this point, so I'm going to ignore that for now. If you decide you need it, just send me a message at X or something.
Now let's start with the content of each file.
- Dockerfile
NOTE: Here, we don't save metrics in a volume, so they're in memory. You can easily extend it to save into a volume. This means here if you restart the Prometheus service, you lose the "previous" data.
FROM prom/prometheus:latest

# bring in our production config
COPY prometheus.yml /etc/prometheus/prometheus.yml

# copy recording and alerting rules
COPY rules/ /etc/prometheus/rules/

# persist and serve metrics
EXPOSE 9090

# health check for container orchestration
HEALTHCHECK --interval=30s --timeout=10s --start-period=30s --retries=3 \
  CMD wget --no-verbose --tries=1 --spider http://localhost:9090/-/healthy || exit 1

# drop privileges for better security
USER nobody

# run Prometheus with production configuration
# - config file location
# - storage path for metrics data
# - 30 day retention period
# - WAL compression for better disk usage
# - lifecycle API for config reloads
# - external URL configuration
# - info level logging
CMD ["--config.file=/etc/prometheus/prometheus.yml", \
     "--storage.tsdb.path=/prometheus", \
     "--storage.tsdb.retention.time=30d", \
     "--storage.tsdb.wal-compression", \
     "--web.enable-lifecycle", \
     "--web.external-url=http://localhost:9090", \
     "--log.level=info"]
- prometheus.yml
# prometheus.yml
# ----------------
global:
  scrape_interval: 15s               # how often to scrape targets
  evaluation_interval: 15s           # how often to evaluate rule expressions
  scrape_timeout: 10s                # timeout for each scrape request
  external_labels:                   # labels for federation/remote write
    environment: 'production'
    region: 'us-east-1'

# Rule files for recording and alerting rules
rule_files:
  - 'rules/*.yml'

scrape_configs:
  # Prometheus’s own metrics
  - job_name: 'prometheus'
    static_configs:
      - targets: ['prometheus:9090']

  # Grafana internal metrics
  - job_name: 'grafana'
    metrics_path: /metrics
    static_configs:
      - targets: ['grafana:3000']

  # cAdvisor on each host (captures container metrics + network‑alias as "alias")
  - job_name: 'cadvisor'
    metrics_path: /metrics
    static_configs:
      - targets:
          - 'cadvisor-<coolify-uuid>:9109'
        labels:
          service: 'cadvisor'
    metric_relabel_configs:
      # 1) fallback: use Docker 'name' label for alias
      - source_labels: [name]
        regex: (.+)
        target_label: alias

      # 2) if Coolify injected serviceName, overwrite alias
      - source_labels: [container_label_coolify_serviceName]
        regex: (.+)
        target_label: alias

      # 3) if you’ve added your own 'alias=' Docker label, that wins
      - source_labels: [container_label_alias]
        regex: (.+)
        target_label: alias

      # drop any metrics without an alias
      - source_labels: [alias]
        regex: ""
        action: drop

  # Node Exporter on each host
  - job_name: 'node_exporter'
    static_configs:
      - targets:
          - 'localhost:9208'
          - '10.255.0.4:9209'
        labels:
          service: 'node_exporter'

  # PostgreSQL exporter on each host
  - job_name: 'postgres_exporter'
    metrics_path: /metrics
    static_configs:
      - targets:
          - 'localhost:9187'
          - '10.255.0.4:9187'
I've included most metrics that you might need and all the Coolify mapping for labels. (I'll share a little bit on that setup later)
- .nvmrc (you really don't care about that, it's for automatic nvm usage of node version)
v22.17.0
Now, deploy this to Coolify as a GitHub repository.
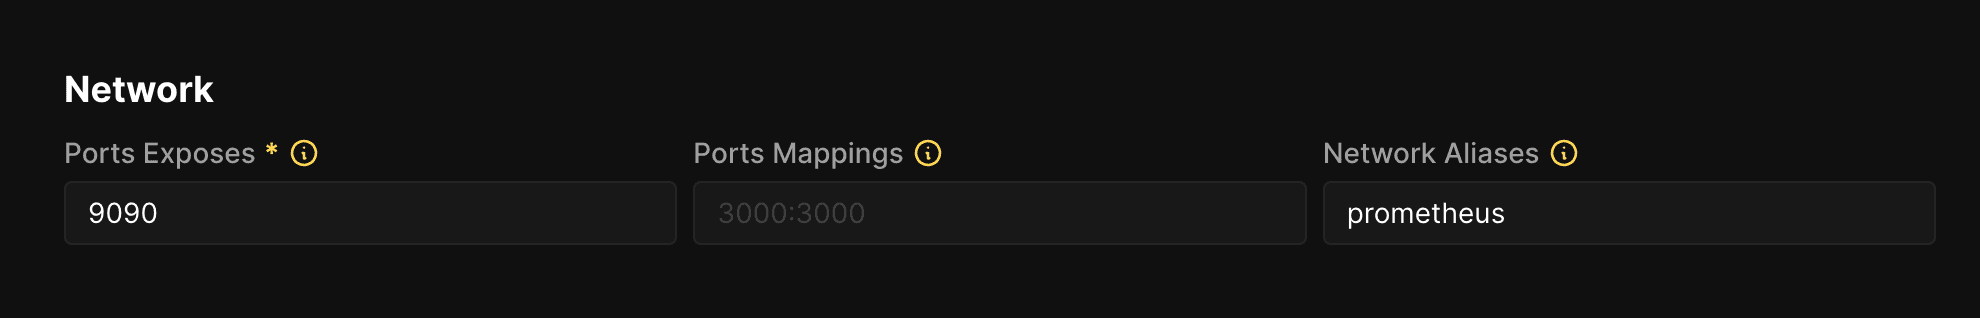
You need those settings in the Coolify service tab, and then deploy.
Deploy cAdvisor to scrape all container metrics
This will be just copy/paste for you.
Go inside Coolify:
- Projects -> -> + Resource
- Select Docker Compose Empty
Paste the following:
version: '3.8'
services:
  cadvisor:
    image: 'gcr.io/cadvisor/cadvisor:v0.52.1'
    container_name: cadvisor
    privileged: true
    restart: always
    ports:
      - '9110:9110'
    command:
      - '--port=9110'
      - '--docker=unix:///var/run/docker.sock'
      - '--store_container_labels=true'
      - '--docker_only=true'
    volumes:
      - '/:/rootfs:ro'
      - '/sys:/sys:ro'
      - '/var/lib/docker:/var/lib/docker:ro'
      - '/var/run/docker.sock:/var/run/docker.sock:ro'
      - '/run/docker.sock:/run/docker.sock:ro'
    devices:
      - /dev/kmsg
    healthcheck:
      test:
        - CMD
        - wget
        - '--no-verbose'
        - '--tries=1'
        - '--spider'
        - 'http://localhost:9110/healthz'
      interval: 30s
      timeout: 10s
      retries: 3
      start_period: 20s
Create the service, and tick the checkbox (Connect To Predefined Network) as the photo below.
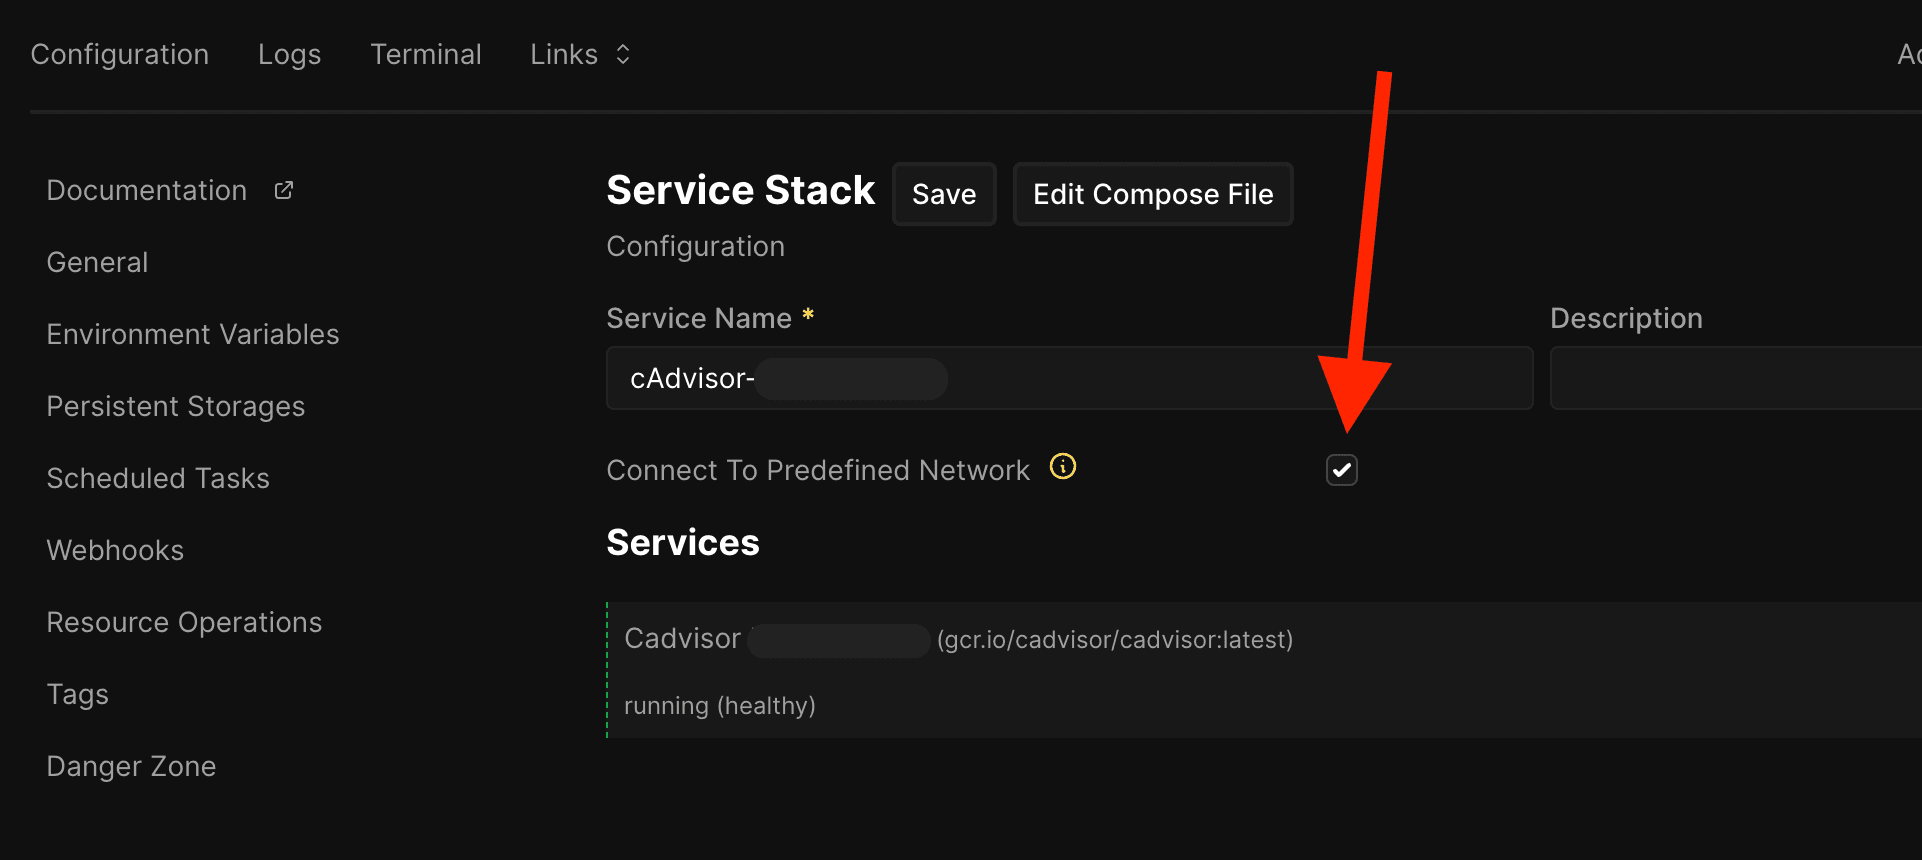
Now... Deploy it.
Hooking up Prometheus in Grafana
If you've followed along, you should already have Grafana at your URL deployed. I'll present a few photos on what to do next.
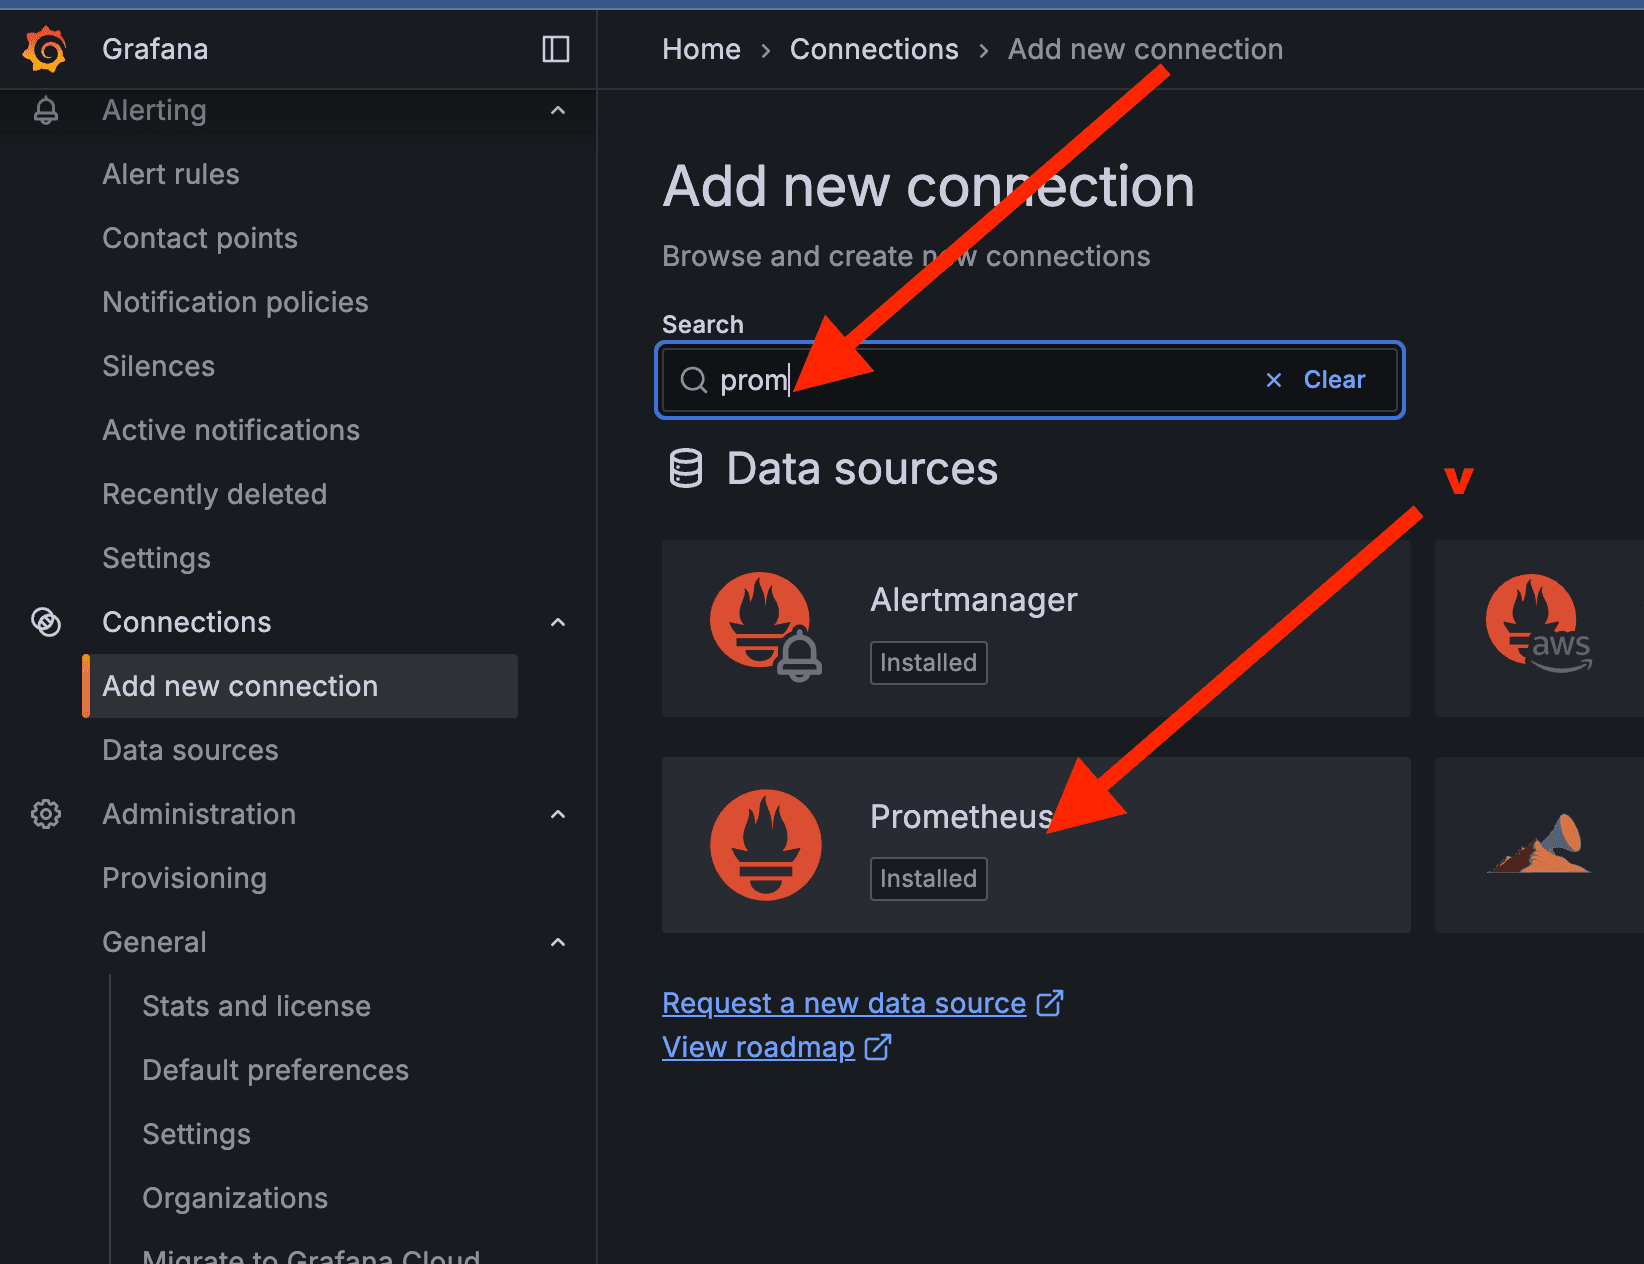
- Go to Connections
- Add new connection
- Search for Prometheus & click on it
- Click on Add Data Source at the top right after
Now follow the photo below:
- Write a name for your Prometheus source - prometheus for me
- For the connection URL, use - http://prometheus:9090. This is what we set up with our repo deployment.
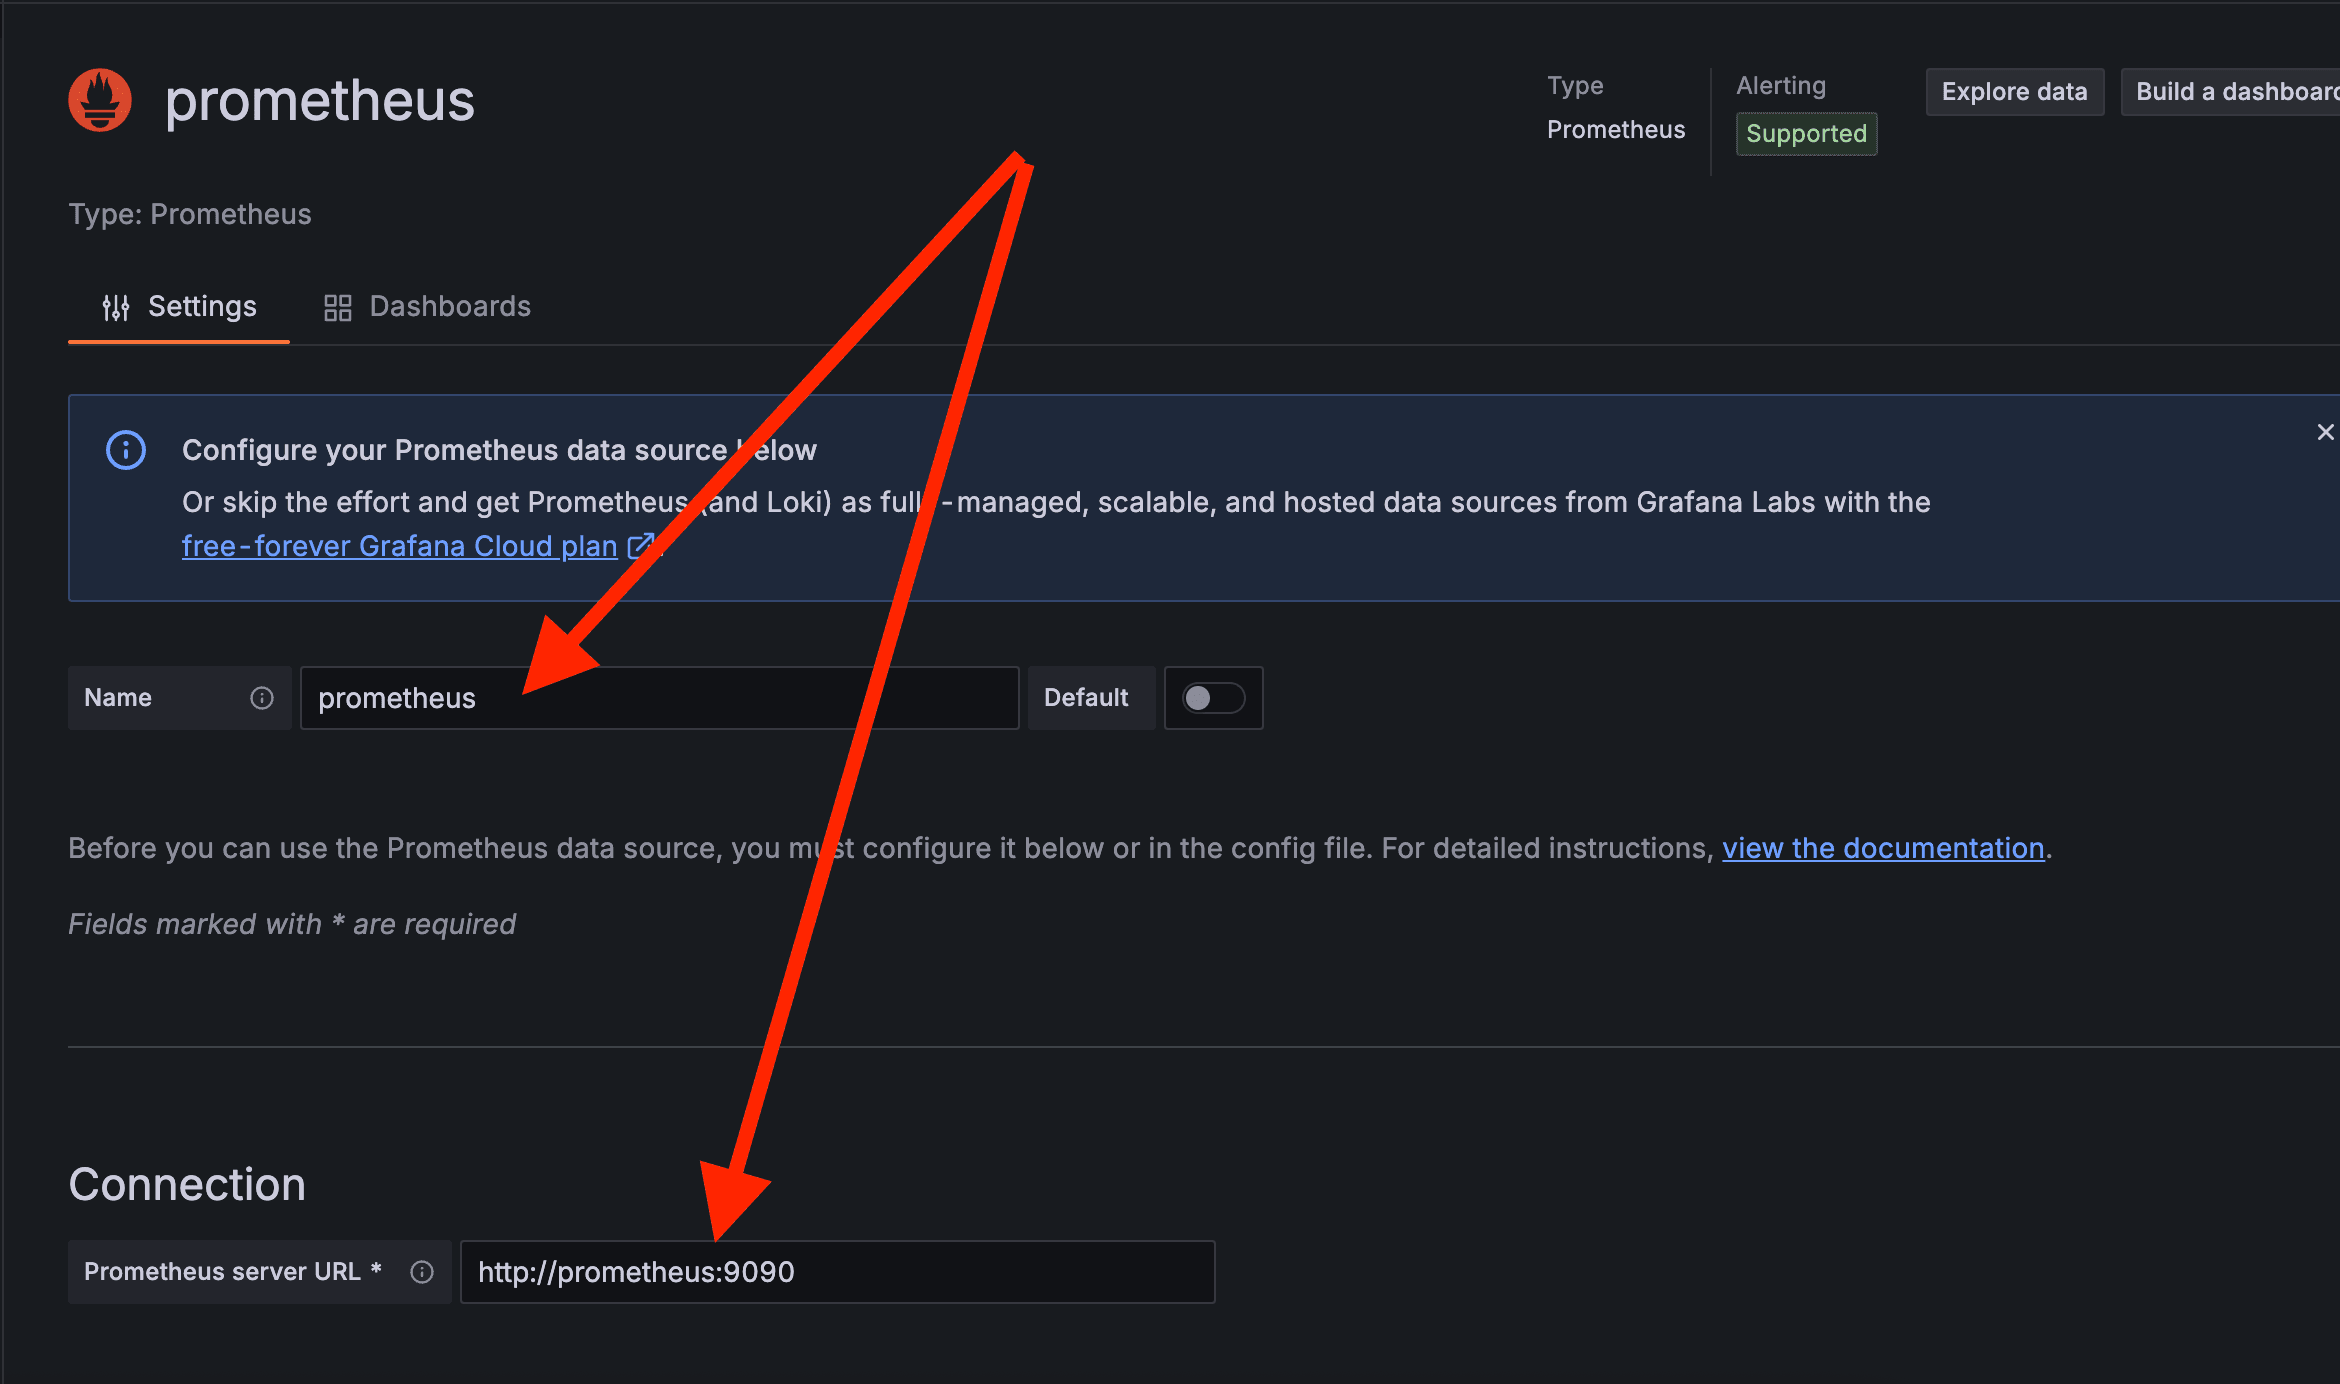
This should be enough to hook up Prometheus in Grafana with Coolify. Let's move to the next steps!
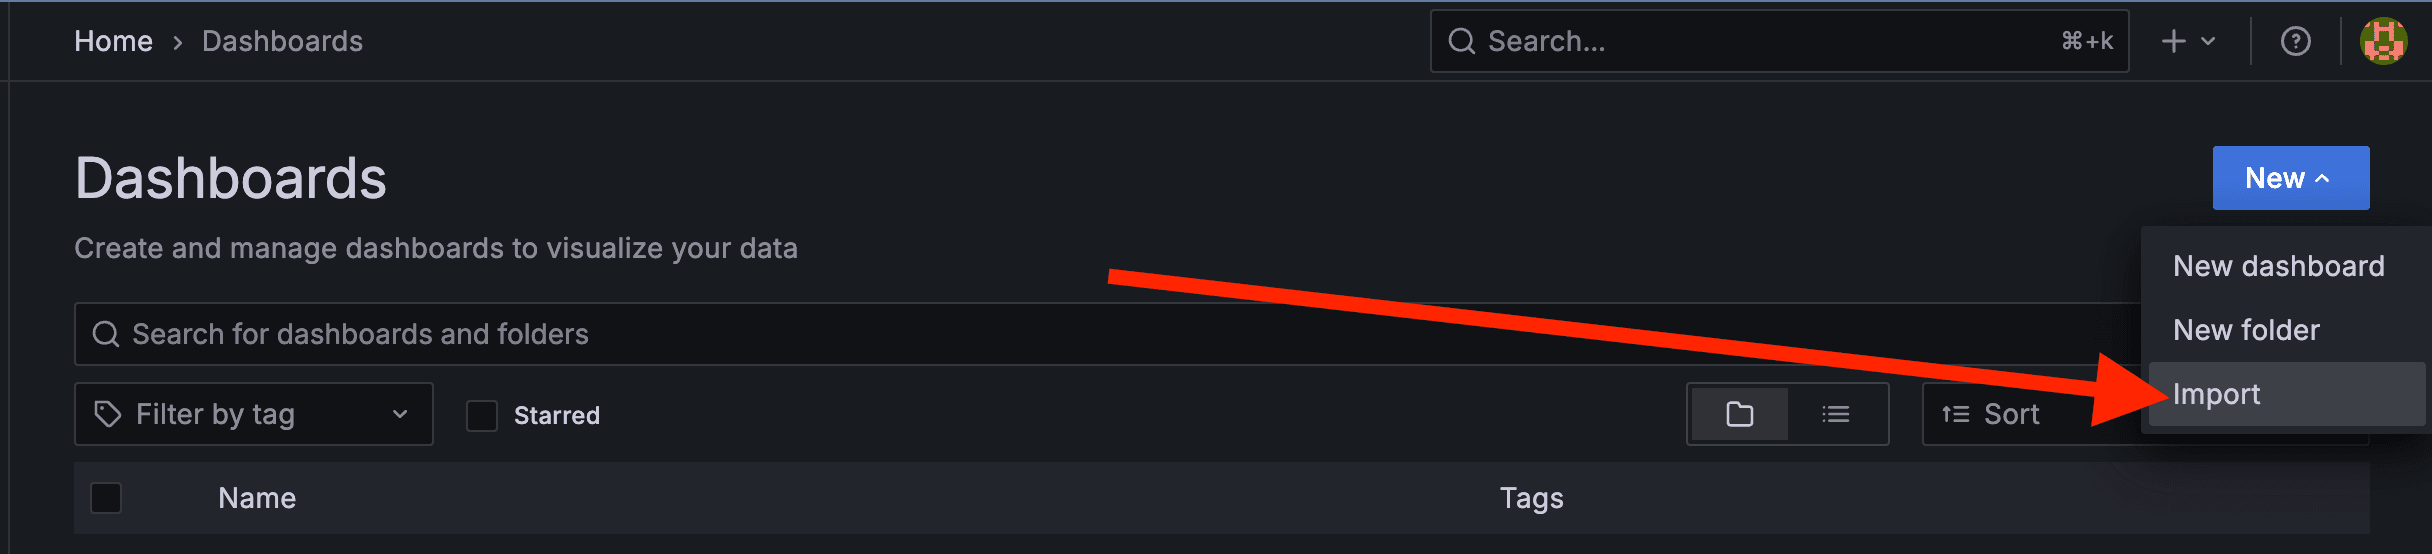
Adding our Grafana Dashboard JSON
- Go to dashboards
- New & Import
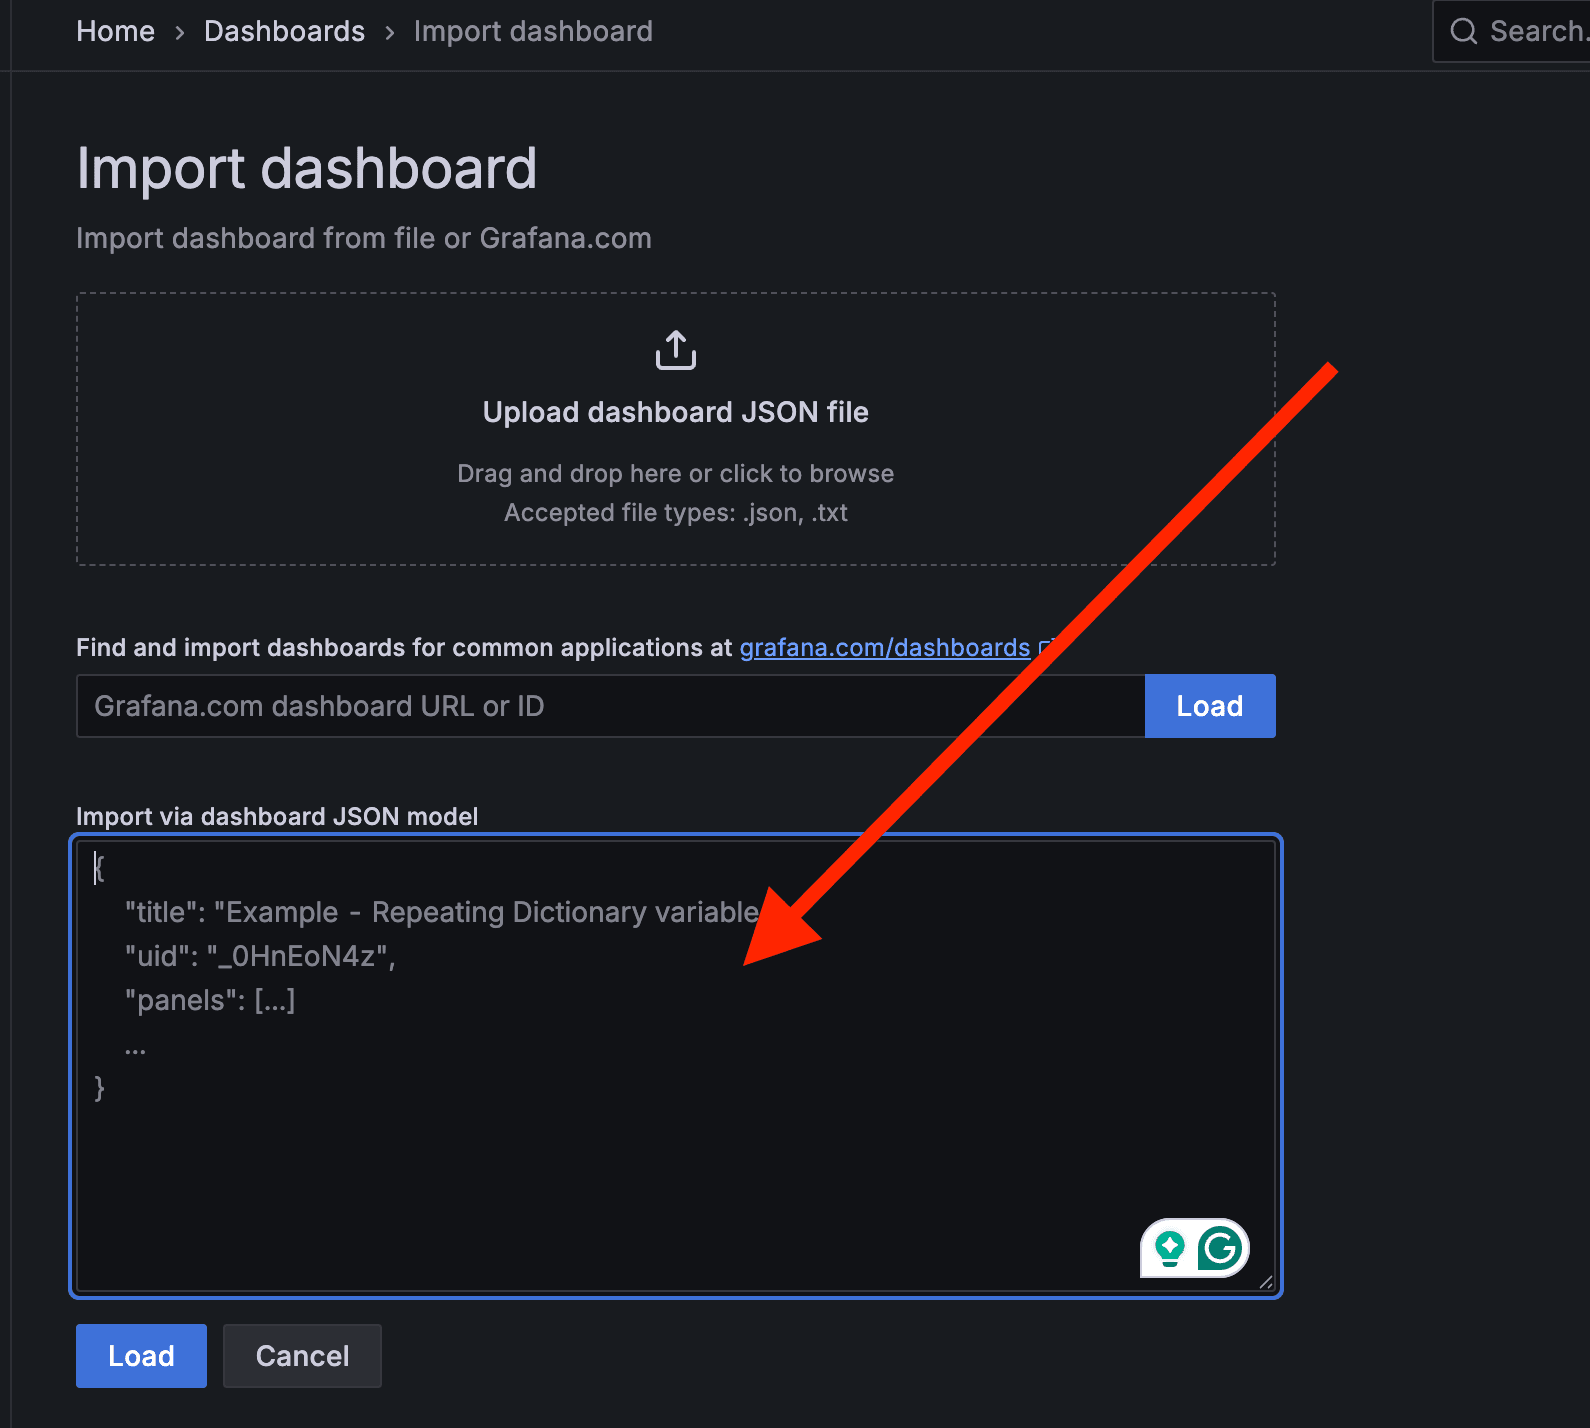
From here, paste the full JSON I'll provide below, and when pasted:
- Click Load
- Choose Prometheus as a data source
Short stop. This article and others take a lot of time... You could support me by following me on X and subscribing to my newsletter!
Here is the full JSON. Note that it worked at the time of writing. Grafana versions change, and you should update because of CVE's and such. This was tested with version 12.1.0 of Grafana, but you can update or test with others.
{
  "__inputs": [
    {
      "name": "DS_PROMETHEUS",
      "label": "prometheus",
      "description": "",
      "type": "datasource",
      "pluginId": "prometheus",
      "pluginName": "Prometheus"
    }
  ],
  "__elements": {},
  "__requires": [
    {
      "type": "grafana",
      "id": "grafana",
      "name": "Grafana",
      "version": "12.1.0"
    },
    {
      "type": "datasource",
      "id": "prometheus",
      "name": "Prometheus",
      "version": "1.0.0"
    },
    {
      "type": "panel",
      "id": "timeseries",
      "name": "Time series",
      "version": ""
    }
  ],
  "annotations": {
    "list": [
      {
        "builtIn": 1,
        "datasource": {
          "type": "grafana",
          "uid": "-- Grafana --"
        },
        "enable": true,
        "hide": true,
        "iconColor": "rgba(0, 211, 255, 1)",
        "name": "Annotations & Alerts",
        "type": "dashboard"
      }
    ]
  },
  "description": "Container metrics by network‑alias",
  "editable": true,
  "fiscalYearStartMonth": 0,
  "graphTooltip": 0,
  "id": null,
  "links": [],
  "panels": [
    {
      "datasource": {
        "type": "prometheus",
        "uid": "${DS_PROMETHEUS}"
      },
      "fieldConfig": {
        "defaults": {
          "color": {
            "mode": "palette-classic"
          },
          "custom": {
            "axisBorderShow": false,
            "axisCenteredZero": false,
            "axisColorMode": "text",
            "axisLabel": "",
            "axisPlacement": "auto",
            "barAlignment": 0,
            "barWidthFactor": 0.6,
            "drawStyle": "line",
            "fillOpacity": 0,
            "gradientMode": "none",
            "hideFrom": {
              "legend": false,
              "tooltip": false,
              "viz": false
            },
            "insertNulls": false,
            "lineInterpolation": "linear",
            "lineWidth": 1,
            "pointSize": 5,
            "scaleDistribution": {
              "type": "linear"
            },
            "showPoints": "auto",
            "spanNulls": false,
            "stacking": {
              "group": "A",
              "mode": "none"
            },
            "thresholdsStyle": {
              "mode": "off"
            }
          },
          "mappings": [],
          "thresholds": {
            "mode": "absolute",
            "steps": [
              {
                "color": "green",
                "value": 0
              },
              {
                "color": "red",
                "value": 80
              }
            ]
          },
          "unit": "core"
        },
        "overrides": []
      },
      "gridPos": {
        "h": 8,
        "w": 12,
        "x": 0,
        "y": 0
      },
      "id": 1,
      "options": {
        "legend": {
          "calcs": [],
          "displayMode": "list",
          "placement": "bottom",
          "showLegend": true
        },
        "tooltip": {
          "hideZeros": false,
          "mode": "single",
          "sort": "none"
        }
      },
      "pluginVersion": "12.1.0",
      "targets": [
        {
          "expr": "sum(rate(container_cpu_usage_seconds_total{instance=~\"$instance\",alias=~\"$alias\"}[5m])) by (alias,instance)",
          "legendFormat": "{{alias}} ({{instance}})",
          "refId": "A",
          "datasource": {
            "type": "prometheus",
            "uid": "${DS_PROMETHEUS}"
          }
        }
      ],
      "title": "CPU Usage (cores)",
      "type": "timeseries"
    },
    {
      "datasource": {
        "type": "prometheus",
        "uid": "${DS_PROMETHEUS}"
      },
      "fieldConfig": {
        "defaults": {
          "color": {
            "mode": "palette-classic"
          },
          "custom": {
            "axisBorderShow": false,
            "axisCenteredZero": false,
            "axisColorMode": "text",
            "axisLabel": "",
            "axisPlacement": "auto",
            "barAlignment": 0,
            "barWidthFactor": 0.6,
            "drawStyle": "line",
            "fillOpacity": 0,
            "gradientMode": "none",
            "hideFrom": {
              "legend": false,
              "tooltip": false,
              "viz": false
            },
            "insertNulls": false,
            "lineInterpolation": "linear",
            "lineWidth": 1,
            "pointSize": 5,
            "scaleDistribution": {
              "type": "linear"
            },
            "showPoints": "auto",
            "spanNulls": false,
            "stacking": {
              "group": "A",
              "mode": "none"
            },
            "thresholdsStyle": {
              "mode": "off"
            }
          },
          "mappings": [],
          "thresholds": {
            "mode": "absolute",
            "steps": [
              {
                "color": "green",
                "value": 0
              },
              {
                "color": "red",
                "value": 80
              }
            ]
          },
          "unit": "bytes"
        },
        "overrides": []
      },
      "gridPos": {
        "h": 8,
        "w": 12,
        "x": 12,
        "y": 0
      },
      "id": 2,
      "options": {
        "legend": {
          "calcs": [],
          "displayMode": "list",
          "placement": "bottom",
          "showLegend": true
        },
        "tooltip": {
          "hideZeros": false,
          "mode": "single",
          "sort": "none"
        }
      },
      "pluginVersion": "12.1.0",
      "targets": [
        {
          "expr": "sum(container_memory_usage_bytes{instance=~\"$instance\",alias=~\"$alias\"}) by (alias,instance)",
          "legendFormat": "{{alias}} ({{instance}})",
          "refId": "B",
          "datasource": {
            "type": "prometheus",
            "uid": "${DS_PROMETHEUS}"
          }
        }
      ],
      "title": "Memory Usage (bytes)",
      "type": "timeseries"
    },
    {
      "datasource": {
        "type": "prometheus",
        "uid": "${DS_PROMETHEUS}"
      },
      "fieldConfig": {
        "defaults": {
          "color": {
            "mode": "palette-classic"
          },
          "custom": {
            "axisBorderShow": false,
            "axisCenteredZero": false,
            "axisColorMode": "text",
            "axisLabel": "",
            "axisPlacement": "auto",
            "barAlignment": 0,
            "barWidthFactor": 0.6,
            "drawStyle": "line",
            "fillOpacity": 0,
            "gradientMode": "none",
            "hideFrom": {
              "legend": false,
              "tooltip": false,
              "viz": false
            },
            "insertNulls": false,
            "lineInterpolation": "linear",
            "lineWidth": 1,
            "pointSize": 5,
            "scaleDistribution": {
              "type": "linear"
            },
            "showPoints": "auto",
            "spanNulls": false,
            "stacking": {
              "group": "A",
              "mode": "none"
            },
            "thresholdsStyle": {
              "mode": "off"
            }
          },
          "mappings": [],
          "thresholds": {
            "mode": "absolute",
            "steps": [
              {
                "color": "green",
                "value": 0
              },
              {
                "color": "red",
                "value": 80
              }
            ]
          },
          "unit": "Bps"
        },
        "overrides": []
      },
      "gridPos": {
        "h": 8,
        "w": 12,
        "x": 0,
        "y": 8
      },
      "id": 3,
      "options": {
        "legend": {
          "calcs": [],
          "displayMode": "list",
          "placement": "bottom",
          "showLegend": true
        },
        "tooltip": {
          "hideZeros": false,
          "mode": "single",
          "sort": "none"
        }
      },
      "pluginVersion": "12.1.0",
      "targets": [
        {
          "expr": "sum(rate(container_network_receive_bytes_total{instance=~\"$instance\",alias=~\"$alias\"}[5m])) by (alias,instance)",
          "legendFormat": "{{alias}} ({{instance}})",
          "refId": "C",
          "datasource": {
            "type": "prometheus",
            "uid": "${DS_PROMETHEUS}"
          }
        }
      ],
      "title": "Network In (bytes/s)",
      "type": "timeseries"
    },
    {
      "datasource": {
        "type": "prometheus",
        "uid": "${DS_PROMETHEUS}"
      },
      "fieldConfig": {
        "defaults": {
          "color": {
            "mode": "palette-classic"
          },
          "custom": {
            "axisBorderShow": false,
            "axisCenteredZero": false,
            "axisColorMode": "text",
            "axisLabel": "",
            "axisPlacement": "auto",
            "barAlignment": 0,
            "barWidthFactor": 0.6,
            "drawStyle": "line",
            "fillOpacity": 0,
            "gradientMode": "none",
            "hideFrom": {
              "legend": false,
              "tooltip": false,
              "viz": false
            },
            "insertNulls": false,
            "lineInterpolation": "linear",
            "lineWidth": 1,
            "pointSize": 5,
            "scaleDistribution": {
              "type": "linear"
            },
            "showPoints": "auto",
            "spanNulls": false,
            "stacking": {
              "group": "A",
              "mode": "none"
            },
            "thresholdsStyle": {
              "mode": "off"
            }
          },
          "mappings": [],
          "thresholds": {
            "mode": "absolute",
            "steps": [
              {
                "color": "green",
                "value": 0
              },
              {
                "color": "red",
                "value": 80
              }
            ]
          },
          "unit": "Bps"
        },
        "overrides": []
      },
      "gridPos": {
        "h": 8,
        "w": 12,
        "x": 12,
        "y": 8
      },
      "id": 4,
      "options": {
        "legend": {
          "calcs": [],
          "displayMode": "list",
          "placement": "bottom",
          "showLegend": true
        },
        "tooltip": {
          "hideZeros": false,
          "mode": "single",
          "sort": "none"
        }
      },
      "pluginVersion": "12.1.0",
      "targets": [
        {
          "expr": "sum(rate(container_network_transmit_bytes_total{instance=~\"$instance\",alias=~\"$alias\"}[5m])) by (alias,instance)",
          "legendFormat": "{{alias}} ({{instance}})",
          "refId": "D",
          "datasource": {
            "type": "prometheus",
            "uid": "${DS_PROMETHEUS}"
          }
        }
      ],
      "title": "Network Out (bytes/s)",
      "type": "timeseries"
    }
  ],
  "refresh": "5s",
  "schemaVersion": 41,
  "tags": [],
  "templating": {
    "list": [
      {
        "allValue": ".*",
        "current": {},
        "datasource": {
          "type": "prometheus",
          "uid": "${DS_PROMETHEUS}"
        },
        "includeAll": true,
        "label": "Host",
        "multi": true,
        "name": "instance",
        "options": [],
        "query": "label_values(container_cpu_usage_seconds_total, instance)",
        "type": "query"
      },
      {
        "allValue": ".*",
        "current": {},
        "datasource": {
          "type": "prometheus",
          "uid": "${DS_PROMETHEUS}"
        },
        "includeAll": true,
        "label": "Alias",
        "multi": true,
        "name": "alias",
        "options": [],
        "query": "label_values(container_cpu_usage_seconds_total{instance=~\"$instance\"}, alias)",
        "type": "query"
      }
    ]
  },
  "time": {
    "from": "now-6h",
    "to": "now"
  },
  "timepicker": {},
  "timezone": "browser",
  "title": "Container Metrics Overview",
  "uid": "240551e1-ea9c-4967-acc3-7937c2ea5eef",
  "version": 1,
  "weekStart": ""
}
You should see something like that after import.
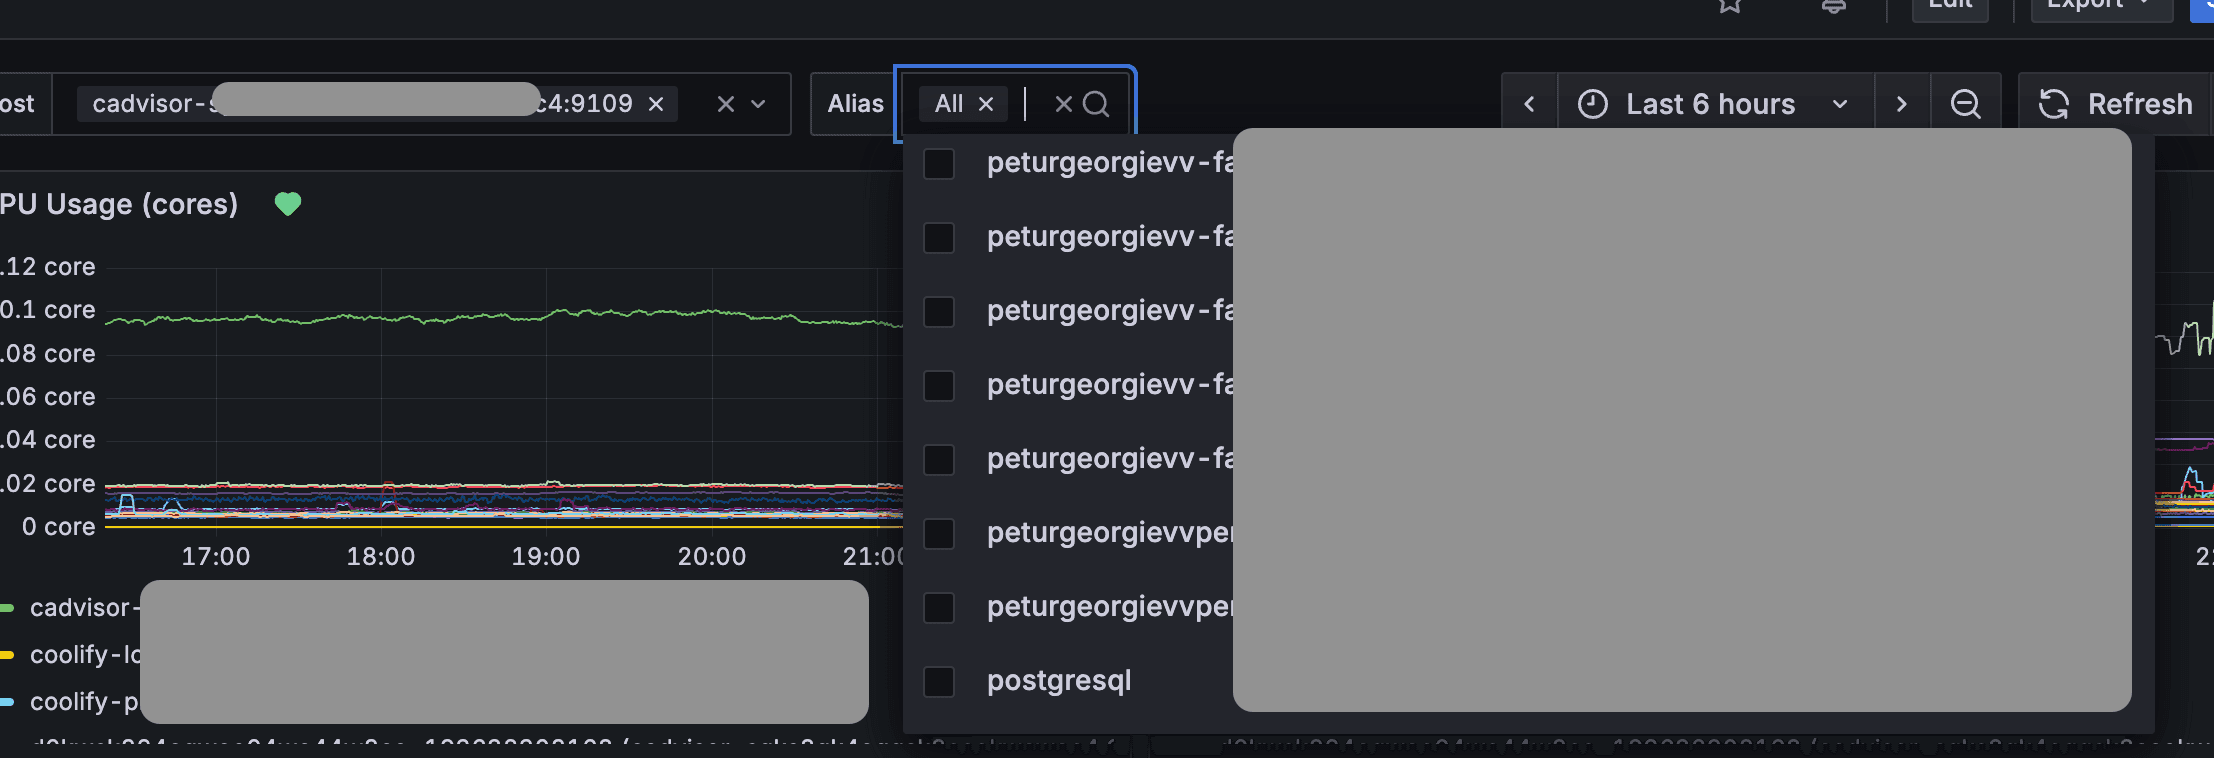
If you don't see proper aliases, here is a quick check for you to do:
- Go to any of your deployed services
- Go to general settings, and see network aliases
- Put an alias and redeploy your service
This works on any deployment with GitHub, otherwise, for docker-compose deployment, it'll use the container_name.
Wrapping it up
Funny thing, while writing this article, I deleted one of my production Grafana dashboards... Good thing I copied the JSON before doing it.
This is a similar setup that I use to monitor some of my projects, like PostFast (social media scheduling & analytics), which became quite large in terms of codebase and quality. You can extend it with alerts for custom metrics, for Kafka lags, BullMQ logging, and a lot more. Hook it up to Discord and you have a fully ready alert system working.
I hope you liked it!
If you have any questions, reach out on Twitter/X or LinkedIn! If you liked the article, or it helped you, there is a "buy me a coffee" button on the bottom right of the page. I'd love the support!
Related articles
How to add REDIS in Coolify with NestJS?
Adding REDIS is a performance boost, and you can easily do so in Coolify.

How to add Discord alarms to self-hosted Netdata (Coolify)
Having monitoring without alerts is like having a laptop without internet. It's good to have, but mainly useless.

How to Build Robust Integrations for your Application? The production way!
Third-party integrations sound easy, but doing them in a way to not degrade the performance of your app is hard.

Is Coolify Good for Production Deployments?
Self-hosting with Coolify can be a pleasent adventure, but you need to know the pros and cons.
How to deploy monitoring on your VPS with Coolify and Netdata
Deploy server-wide monitoring with Netdata and Docker compose for any VPS. Use in Coolify with a GitHub repository.

Create Production Dockerfile for NextJS - Deploy Everywhere
Dockerfiles aren't hard to do. You do it once per framerwork like NextJS and use everywhere!
My Newsletter
Subscribe to my newsletter and get the latest articles and updates in your inbox!